Immigrants from Ghana vs South American Indian Male Unemployment
COMPARE
Immigrants from Ghana
South American Indian
Male Unemployment
Male Unemployment Comparison
Immigrants from Ghana
South American Indians
6.2%
MALE UNEMPLOYMENT
0.0/ 100
METRIC RATING
280th/ 347
METRIC RANK
5.5%
MALE UNEMPLOYMENT
7.6/ 100
METRIC RATING
210th/ 347
METRIC RANK
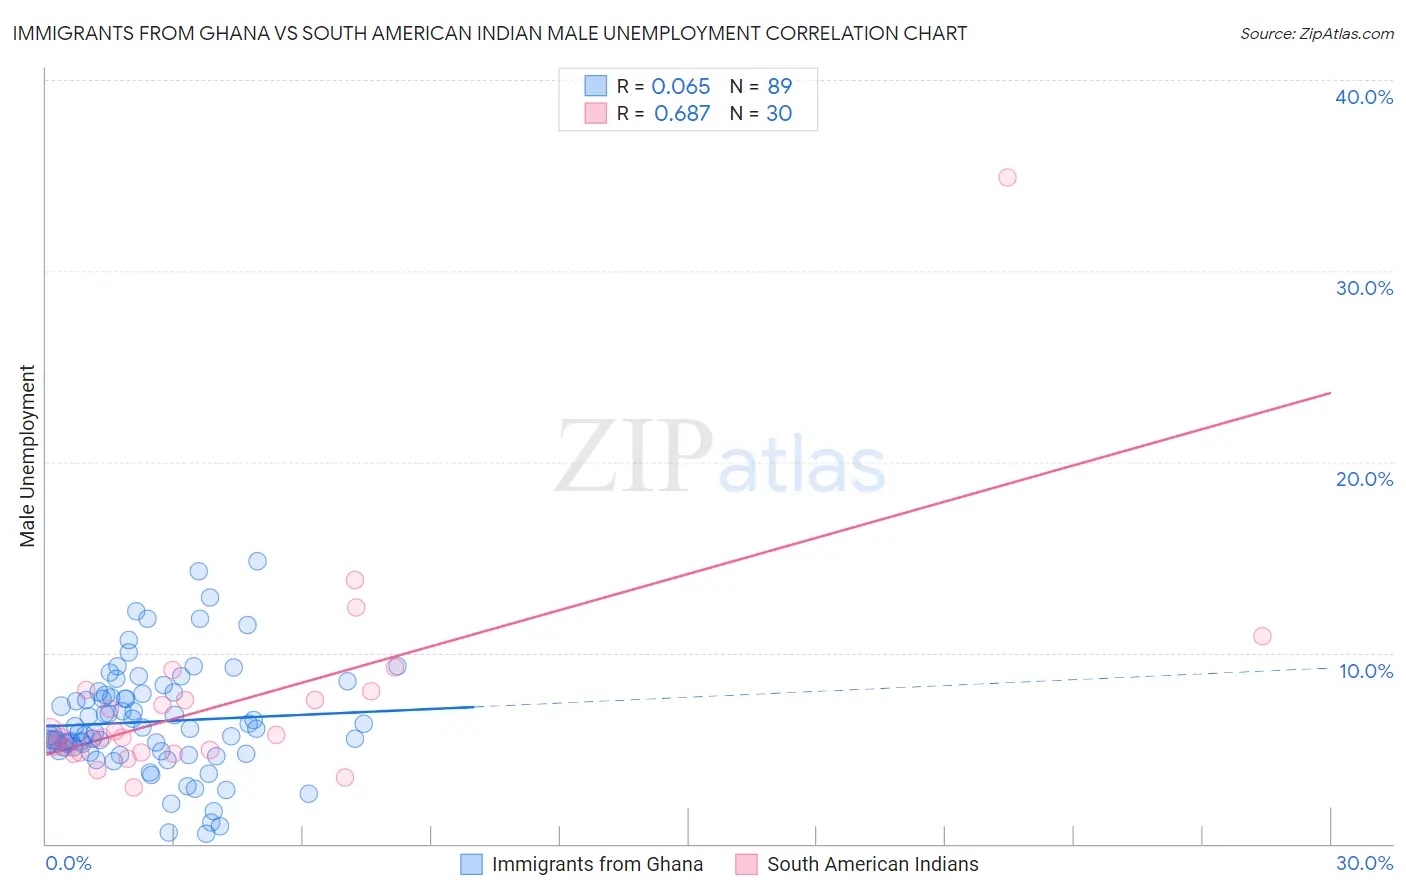
Immigrants from Ghana vs South American Indian Male Unemployment Correlation Chart
The statistical analysis conducted on geographies consisting of 199,472,146 people shows a slight positive correlation between the proportion of Immigrants from Ghana and unemployment rate among males in the United States with a correlation coefficient (R) of 0.065 and weighted average of 6.2%. Similarly, the statistical analysis conducted on geographies consisting of 164,403,972 people shows a significant positive correlation between the proportion of South American Indians and unemployment rate among males in the United States with a correlation coefficient (R) of 0.687 and weighted average of 5.5%, a difference of 12.1%.
Male Unemployment Correlation Summary
| Measurement | Immigrants from Ghana | South American Indian |
| Minimum | 0.50% | 2.9% |
| Maximum | 14.8% | 34.9% |
| Range | 14.3% | 32.0% |
| Mean | 6.4% | 7.5% |
| Median | 5.9% | 5.6% |
| Interquartile 25% (IQ1) | 4.9% | 4.8% |
| Interquartile 75% (IQ3) | 7.8% | 8.0% |
| Interquartile Range (IQR) | 3.0% | 3.2% |
| Standard Deviation (Sample) | 2.8% | 5.8% |
| Standard Deviation (Population) | 2.8% | 5.7% |
Similar Demographics by Male Unemployment
Demographics Similar to Immigrants from Ghana by Male Unemployment
In terms of male unemployment, the demographic groups most similar to Immigrants from Ghana are Sierra Leonean (6.2%, a difference of 0.070%), Ecuadorian (6.2%, a difference of 0.50%), Immigrants from Western Africa (6.2%, a difference of 0.53%), Ghanaian (6.1%, a difference of 0.99%), and Spanish American Indian (6.2%, a difference of 1.2%).
| Demographics | Rating | Rank | Male Unemployment |
| Armenians | 0.0 /100 | #273 | Tragic 6.0% |
| Immigrants | Sierra Leone | 0.0 /100 | #274 | Tragic 6.0% |
| Menominee | 0.0 /100 | #275 | Tragic 6.0% |
| Tlingit-Haida | 0.0 /100 | #276 | Tragic 6.0% |
| Immigrants | Liberia | 0.0 /100 | #277 | Tragic 6.1% |
| Immigrants | Fiji | 0.0 /100 | #278 | Tragic 6.1% |
| Ghanaians | 0.0 /100 | #279 | Tragic 6.1% |
| Immigrants | Ghana | 0.0 /100 | #280 | Tragic 6.2% |
| Sierra Leoneans | 0.0 /100 | #281 | Tragic 6.2% |
| Ecuadorians | 0.0 /100 | #282 | Tragic 6.2% |
| Immigrants | Western Africa | 0.0 /100 | #283 | Tragic 6.2% |
| Spanish American Indians | 0.0 /100 | #284 | Tragic 6.2% |
| Immigrants | Ecuador | 0.0 /100 | #285 | Tragic 6.2% |
| Africans | 0.0 /100 | #286 | Tragic 6.3% |
| Central American Indians | 0.0 /100 | #287 | Tragic 6.3% |
Demographics Similar to South American Indians by Male Unemployment
In terms of male unemployment, the demographic groups most similar to South American Indians are Israeli (5.5%, a difference of 0.040%), Immigrants from Middle Africa (5.5%, a difference of 0.13%), Hmong (5.5%, a difference of 0.14%), Immigrants from Lebanon (5.5%, a difference of 0.18%), and Ugandan (5.5%, a difference of 0.30%).
| Demographics | Rating | Rank | Male Unemployment |
| Immigrants | Laos | 13.0 /100 | #203 | Poor 5.4% |
| Guamanians/Chamorros | 12.3 /100 | #204 | Poor 5.4% |
| Immigrants | Costa Rica | 11.4 /100 | #205 | Poor 5.5% |
| Immigrants | Ukraine | 9.9 /100 | #206 | Tragic 5.5% |
| Immigrants | Syria | 9.3 /100 | #207 | Tragic 5.5% |
| Immigrants | Lebanon | 8.6 /100 | #208 | Tragic 5.5% |
| Immigrants | Middle Africa | 8.3 /100 | #209 | Tragic 5.5% |
| South American Indians | 7.6 /100 | #210 | Tragic 5.5% |
| Israelis | 7.4 /100 | #211 | Tragic 5.5% |
| Hmong | 7.0 /100 | #212 | Tragic 5.5% |
| Ugandans | 6.3 /100 | #213 | Tragic 5.5% |
| Puget Sound Salish | 5.6 /100 | #214 | Tragic 5.5% |
| Samoans | 4.9 /100 | #215 | Tragic 5.5% |
| Immigrants | Immigrants | 4.3 /100 | #216 | Tragic 5.5% |
| Delaware | 4.2 /100 | #217 | Tragic 5.5% |