Immigrants from Ghana vs South American Indian College, Under 1 year
COMPARE
Immigrants from Ghana
South American Indian
College, Under 1 year
College, Under 1 year Comparison
Immigrants from Ghana
South American Indians
63.1%
COLLEGE, UNDER 1 YEAR
3.7/ 100
METRIC RATING
227th/ 347
METRIC RANK
65.5%
COLLEGE, UNDER 1 YEAR
54.4/ 100
METRIC RATING
172nd/ 347
METRIC RANK
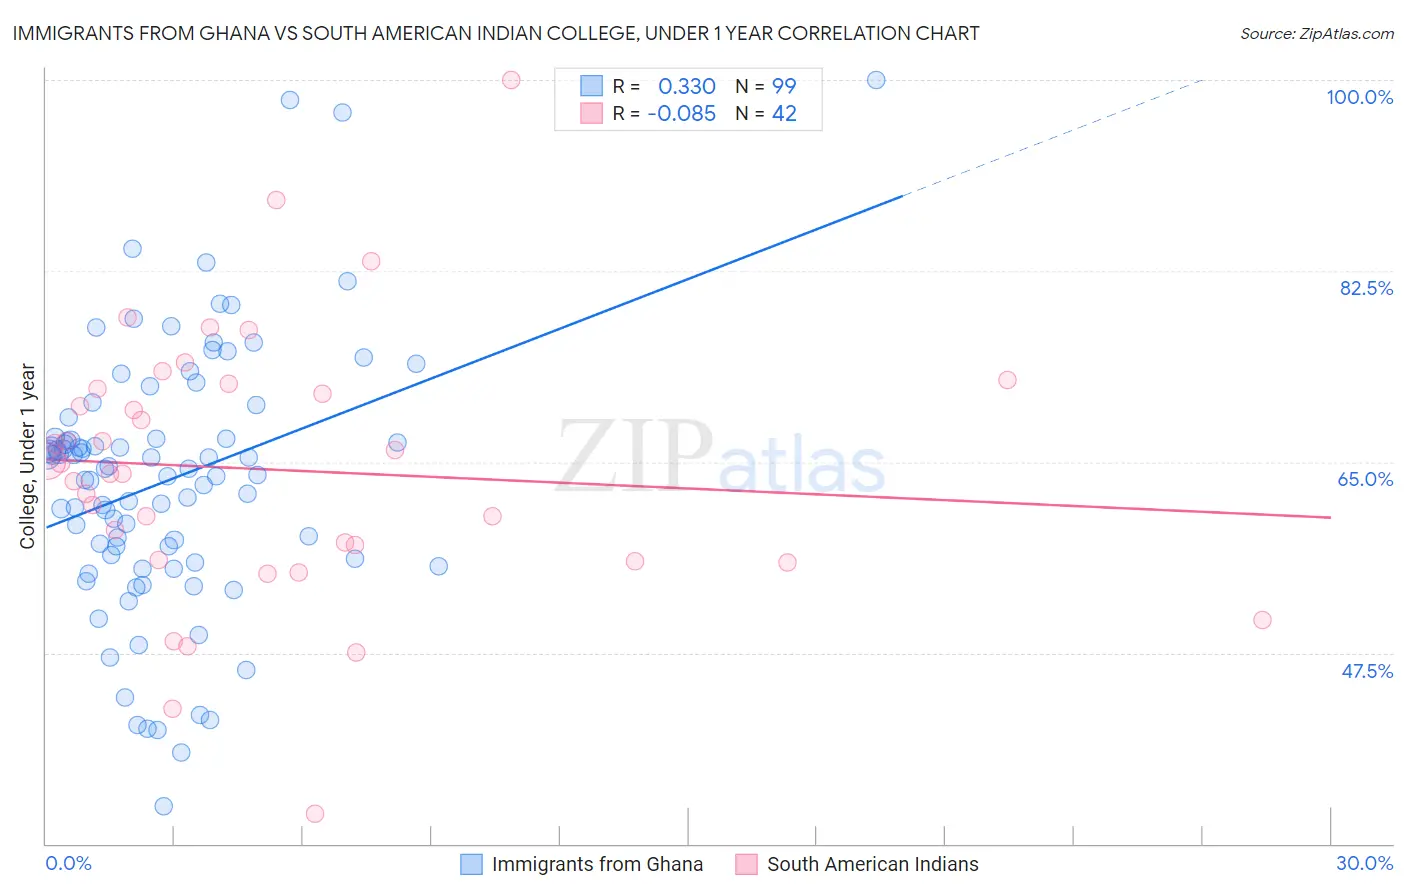
Immigrants from Ghana vs South American Indian College, Under 1 year Correlation Chart
The statistical analysis conducted on geographies consisting of 199,951,982 people shows a mild positive correlation between the proportion of Immigrants from Ghana and percentage of population with at least college, under 1 year education in the United States with a correlation coefficient (R) of 0.330 and weighted average of 63.1%. Similarly, the statistical analysis conducted on geographies consisting of 164,573,280 people shows a slight negative correlation between the proportion of South American Indians and percentage of population with at least college, under 1 year education in the United States with a correlation coefficient (R) of -0.085 and weighted average of 65.5%, a difference of 3.9%.
College, Under 1 year Correlation Summary
| Measurement | Immigrants from Ghana | South American Indian |
| Minimum | 33.5% | 32.7% |
| Maximum | 100.0% | 100.0% |
| Range | 66.5% | 67.3% |
| Mean | 63.3% | 64.3% |
| Median | 64.4% | 64.4% |
| Interquartile 25% (IQ1) | 56.1% | 56.0% |
| Interquartile 75% (IQ3) | 67.3% | 71.7% |
| Interquartile Range (IQR) | 11.2% | 15.7% |
| Standard Deviation (Sample) | 12.1% | 12.4% |
| Standard Deviation (Population) | 12.1% | 12.3% |
Similar Demographics by College, Under 1 year
Demographics Similar to Immigrants from Ghana by College, Under 1 year
In terms of college, under 1 year, the demographic groups most similar to Immigrants from Ghana are Immigrants from Colombia (63.1%, a difference of 0.090%), Immigrants from Peru (63.1%, a difference of 0.11%), Samoan (63.0%, a difference of 0.11%), Liberian (63.0%, a difference of 0.17%), and Subsaharan African (63.2%, a difference of 0.21%).
| Demographics | Rating | Rank | College, Under 1 year |
| Portuguese | 5.6 /100 | #220 | Tragic 63.4% |
| Cree | 5.2 /100 | #221 | Tragic 63.3% |
| Immigrants | Senegal | 5.0 /100 | #222 | Tragic 63.3% |
| Immigrants | Costa Rica | 4.5 /100 | #223 | Tragic 63.2% |
| Sub-Saharan Africans | 4.4 /100 | #224 | Tragic 63.2% |
| Immigrants | Peru | 4.0 /100 | #225 | Tragic 63.1% |
| Immigrants | Colombia | 4.0 /100 | #226 | Tragic 63.1% |
| Immigrants | Ghana | 3.7 /100 | #227 | Tragic 63.1% |
| Samoans | 3.3 /100 | #228 | Tragic 63.0% |
| Liberians | 3.2 /100 | #229 | Tragic 63.0% |
| Immigrants | Nonimmigrants | 3.0 /100 | #230 | Tragic 62.9% |
| Immigrants | Western Africa | 2.4 /100 | #231 | Tragic 62.8% |
| Osage | 2.2 /100 | #232 | Tragic 62.7% |
| Iroquois | 2.0 /100 | #233 | Tragic 62.6% |
| Chippewa | 2.0 /100 | #234 | Tragic 62.6% |
Demographics Similar to South American Indians by College, Under 1 year
In terms of college, under 1 year, the demographic groups most similar to South American Indians are Swiss (65.5%, a difference of 0.020%), Immigrants from Oceania (65.6%, a difference of 0.030%), Yugoslavian (65.6%, a difference of 0.060%), German (65.6%, a difference of 0.060%), and Hungarian (65.6%, a difference of 0.070%).
| Demographics | Rating | Rank | College, Under 1 year |
| Immigrants | Uzbekistan | 61.6 /100 | #165 | Good 65.8% |
| Moroccans | 56.7 /100 | #166 | Average 65.6% |
| Immigrants | Somalia | 56.4 /100 | #167 | Average 65.6% |
| Hungarians | 55.9 /100 | #168 | Average 65.6% |
| Yugoslavians | 55.7 /100 | #169 | Average 65.6% |
| Germans | 55.7 /100 | #170 | Average 65.6% |
| Immigrants | Oceania | 55.0 /100 | #171 | Average 65.6% |
| South American Indians | 54.4 /100 | #172 | Average 65.5% |
| Swiss | 53.9 /100 | #173 | Average 65.5% |
| Immigrants | Bosnia and Herzegovina | 50.0 /100 | #174 | Average 65.4% |
| Scotch-Irish | 49.5 /100 | #175 | Average 65.4% |
| French | 48.9 /100 | #176 | Average 65.4% |
| Immigrants | North Macedonia | 48.6 /100 | #177 | Average 65.4% |
| German Russians | 48.3 /100 | #178 | Average 65.4% |
| Guamanians/Chamorros | 48.2 /100 | #179 | Average 65.4% |