Immigrants from China vs Arab In Labor Force | Age 35-44
COMPARE
Immigrants from China
Arab
In Labor Force | Age 35-44
In Labor Force | Age 35-44 Comparison
Immigrants from China
Arabs
84.7%
IN LABOR FORCE | AGE 35-44
92.3/ 100
METRIC RATING
117th/ 347
METRIC RANK
83.8%
IN LABOR FORCE | AGE 35-44
1.3/ 100
METRIC RATING
240th/ 347
METRIC RANK
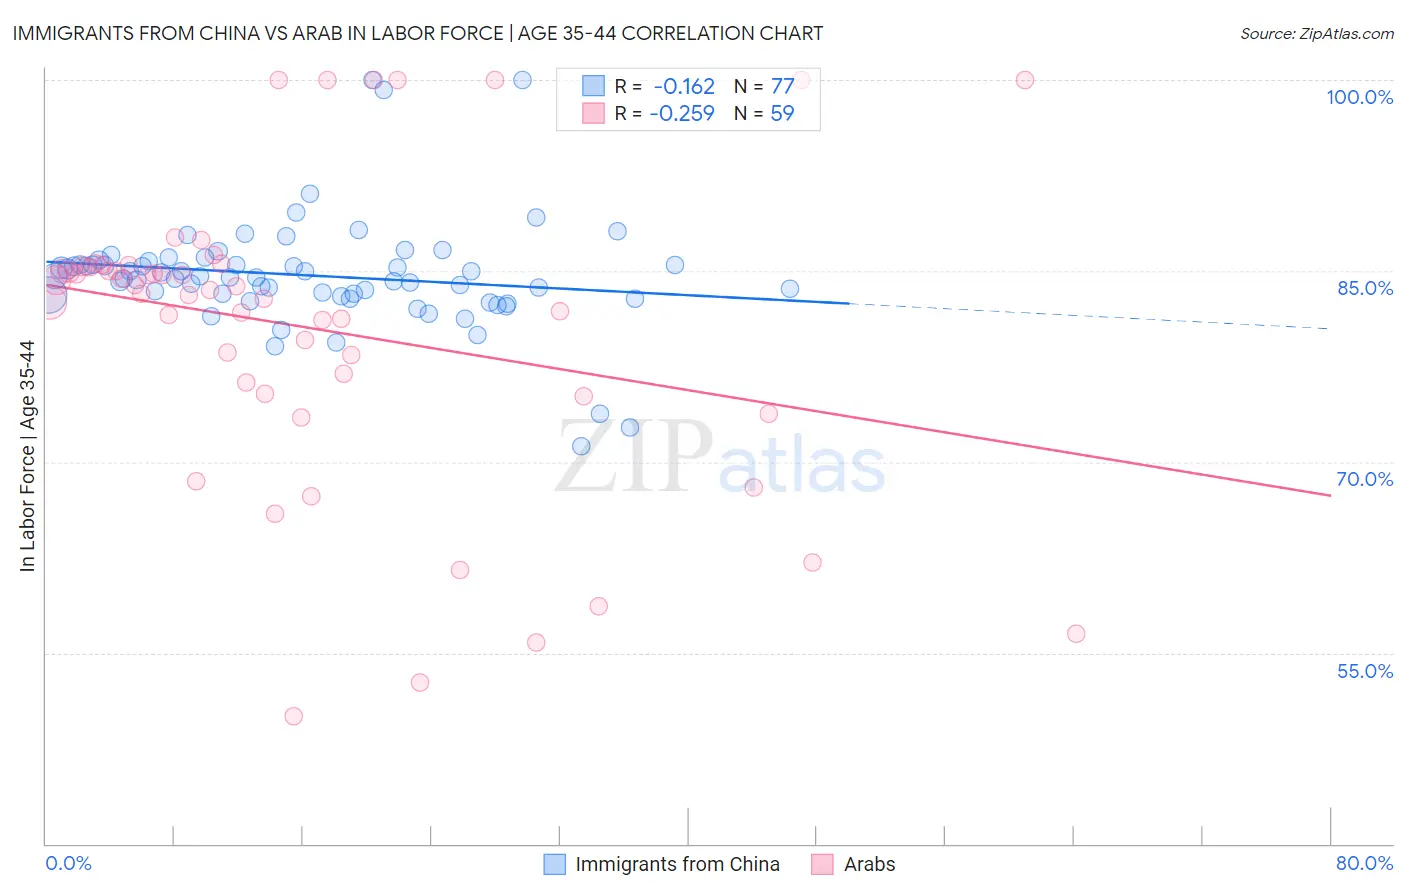
Immigrants from China vs Arab In Labor Force | Age 35-44 Correlation Chart
The statistical analysis conducted on geographies consisting of 456,678,998 people shows a poor negative correlation between the proportion of Immigrants from China and labor force participation rate among population between the ages 35 and 44 in the United States with a correlation coefficient (R) of -0.162 and weighted average of 84.7%. Similarly, the statistical analysis conducted on geographies consisting of 486,455,192 people shows a weak negative correlation between the proportion of Arabs and labor force participation rate among population between the ages 35 and 44 in the United States with a correlation coefficient (R) of -0.259 and weighted average of 83.8%, a difference of 1.1%.
In Labor Force | Age 35-44 Correlation Summary
| Measurement | Immigrants from China | Arab |
| Minimum | 71.2% | 50.0% |
| Maximum | 100.0% | 100.0% |
| Range | 28.8% | 50.0% |
| Mean | 84.6% | 80.5% |
| Median | 84.5% | 83.5% |
| Interquartile 25% (IQ1) | 83.1% | 75.3% |
| Interquartile 75% (IQ3) | 85.6% | 85.3% |
| Interquartile Range (IQR) | 2.5% | 10.0% |
| Standard Deviation (Sample) | 4.4% | 11.8% |
| Standard Deviation (Population) | 4.4% | 11.7% |
Similar Demographics by In Labor Force | Age 35-44
Demographics Similar to Immigrants from China by In Labor Force | Age 35-44
In terms of in labor force | age 35-44, the demographic groups most similar to Immigrants from China are Immigrants from Eastern Asia (84.7%, a difference of 0.0%), Immigrants from Egypt (84.7%, a difference of 0.010%), Burmese (84.7%, a difference of 0.010%), Uruguayan (84.7%, a difference of 0.020%), and Chilean (84.7%, a difference of 0.020%).
| Demographics | Rating | Rank | In Labor Force | Age 35-44 |
| Filipinos | 93.8 /100 | #110 | Exceptional 84.7% |
| Ukrainians | 93.5 /100 | #111 | Exceptional 84.7% |
| Immigrants | Western Africa | 93.4 /100 | #112 | Exceptional 84.7% |
| Uruguayans | 93.3 /100 | #113 | Exceptional 84.7% |
| Chileans | 93.2 /100 | #114 | Exceptional 84.7% |
| Bahamians | 93.2 /100 | #115 | Exceptional 84.7% |
| Immigrants | Egypt | 92.7 /100 | #116 | Exceptional 84.7% |
| Immigrants | China | 92.3 /100 | #117 | Exceptional 84.7% |
| Immigrants | Eastern Asia | 92.1 /100 | #118 | Exceptional 84.7% |
| Burmese | 91.8 /100 | #119 | Exceptional 84.7% |
| Immigrants | Northern Europe | 91.5 /100 | #120 | Exceptional 84.7% |
| Finns | 91.2 /100 | #121 | Exceptional 84.7% |
| Germans | 91.0 /100 | #122 | Exceptional 84.7% |
| Immigrants | South America | 90.9 /100 | #123 | Exceptional 84.7% |
| Slavs | 90.8 /100 | #124 | Exceptional 84.7% |
Demographics Similar to Arabs by In Labor Force | Age 35-44
In terms of in labor force | age 35-44, the demographic groups most similar to Arabs are Celtic (83.8%, a difference of 0.0%), Iraqi (83.8%, a difference of 0.0%), Immigrants from Cambodia (83.8%, a difference of 0.030%), Immigrants from Western Asia (83.8%, a difference of 0.030%), and Guyanese (83.8%, a difference of 0.030%).
| Demographics | Rating | Rank | In Labor Force | Age 35-44 |
| Immigrants | Germany | 2.8 /100 | #233 | Tragic 83.9% |
| Immigrants | Oceania | 2.6 /100 | #234 | Tragic 83.9% |
| Immigrants | Syria | 2.5 /100 | #235 | Tragic 83.9% |
| West Indians | 2.4 /100 | #236 | Tragic 83.9% |
| English | 1.8 /100 | #237 | Tragic 83.8% |
| Immigrants | Laos | 1.7 /100 | #238 | Tragic 83.8% |
| Celtics | 1.4 /100 | #239 | Tragic 83.8% |
| Arabs | 1.3 /100 | #240 | Tragic 83.8% |
| Iraqis | 1.3 /100 | #241 | Tragic 83.8% |
| Immigrants | Cambodia | 1.1 /100 | #242 | Tragic 83.8% |
| Immigrants | Western Asia | 1.1 /100 | #243 | Tragic 83.8% |
| Guyanese | 1.1 /100 | #244 | Tragic 83.8% |
| Malaysians | 1.1 /100 | #245 | Tragic 83.8% |
| Immigrants | Immigrants | 1.0 /100 | #246 | Tragic 83.7% |
| Immigrants | Armenia | 0.9 /100 | #247 | Tragic 83.7% |