British West Indian vs Arab In Labor Force | Age 35-44
COMPARE
British West Indian
Arab
In Labor Force | Age 35-44
In Labor Force | Age 35-44 Comparison
British West Indians
Arabs
84.0%
IN LABOR FORCE | AGE 35-44
5.3/ 100
METRIC RATING
227th/ 347
METRIC RANK
83.8%
IN LABOR FORCE | AGE 35-44
1.3/ 100
METRIC RATING
240th/ 347
METRIC RANK
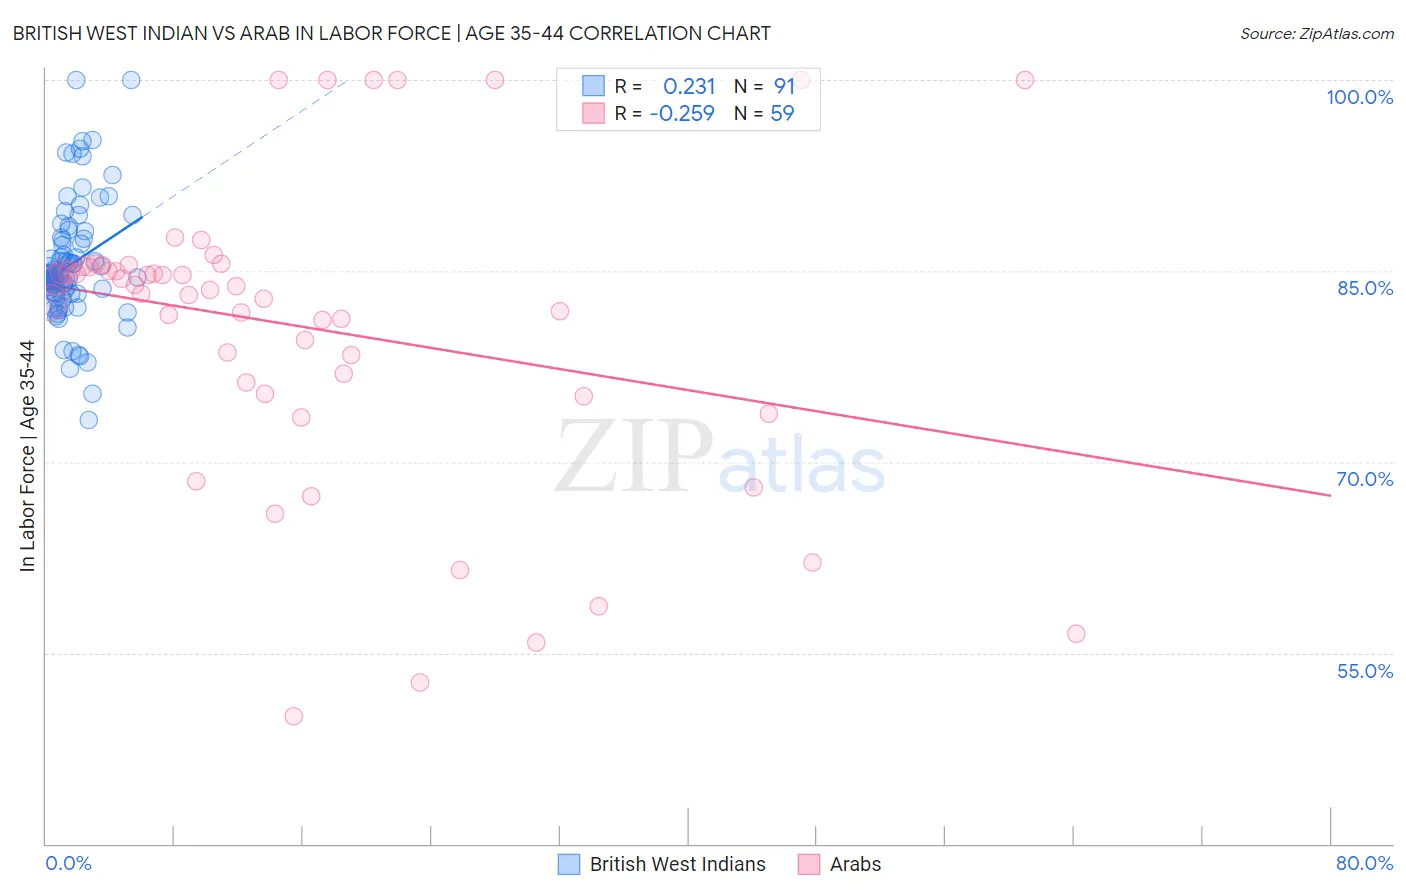
British West Indian vs Arab In Labor Force | Age 35-44 Correlation Chart
The statistical analysis conducted on geographies consisting of 152,566,094 people shows a weak positive correlation between the proportion of British West Indians and labor force participation rate among population between the ages 35 and 44 in the United States with a correlation coefficient (R) of 0.231 and weighted average of 84.0%. Similarly, the statistical analysis conducted on geographies consisting of 486,455,192 people shows a weak negative correlation between the proportion of Arabs and labor force participation rate among population between the ages 35 and 44 in the United States with a correlation coefficient (R) of -0.259 and weighted average of 83.8%, a difference of 0.23%.
In Labor Force | Age 35-44 Correlation Summary
| Measurement | British West Indian | Arab |
| Minimum | 73.3% | 50.0% |
| Maximum | 100.0% | 100.0% |
| Range | 26.7% | 50.0% |
| Mean | 85.5% | 80.5% |
| Median | 84.7% | 83.5% |
| Interquartile 25% (IQ1) | 83.3% | 75.3% |
| Interquartile 75% (IQ3) | 87.5% | 85.3% |
| Interquartile Range (IQR) | 4.2% | 10.0% |
| Standard Deviation (Sample) | 4.7% | 11.8% |
| Standard Deviation (Population) | 4.7% | 11.7% |
Demographics Similar to British West Indians and Arabs by In Labor Force | Age 35-44
In terms of in labor force | age 35-44, the demographic groups most similar to British West Indians are Panamanian (84.0%, a difference of 0.0%), Welsh (84.0%, a difference of 0.0%), U.S. Virgin Islander (84.0%, a difference of 0.020%), Immigrants from Burma/Myanmar (84.0%, a difference of 0.020%), and Immigrants from Thailand (84.0%, a difference of 0.020%). Similarly, the demographic groups most similar to Arabs are Celtic (83.8%, a difference of 0.0%), Iraqi (83.8%, a difference of 0.0%), Immigrants from Cambodia (83.8%, a difference of 0.030%), Immigrants from Western Asia (83.8%, a difference of 0.030%), and Immigrants from Laos (83.8%, a difference of 0.040%).
| Demographics | Rating | Rank | In Labor Force | Age 35-44 |
| Immigrants | Panama | 6.4 /100 | #223 | Tragic 84.0% |
| U.S. Virgin Islanders | 6.1 /100 | #224 | Tragic 84.0% |
| Immigrants | Burma/Myanmar | 6.1 /100 | #225 | Tragic 84.0% |
| Panamanians | 5.4 /100 | #226 | Tragic 84.0% |
| British West Indians | 5.3 /100 | #227 | Tragic 84.0% |
| Welsh | 5.3 /100 | #228 | Tragic 84.0% |
| Immigrants | Thailand | 4.7 /100 | #229 | Tragic 84.0% |
| Immigrants | Iraq | 3.7 /100 | #230 | Tragic 83.9% |
| Scottish | 3.2 /100 | #231 | Tragic 83.9% |
| Native Hawaiians | 3.0 /100 | #232 | Tragic 83.9% |
| Immigrants | Germany | 2.8 /100 | #233 | Tragic 83.9% |
| Immigrants | Oceania | 2.6 /100 | #234 | Tragic 83.9% |
| Immigrants | Syria | 2.5 /100 | #235 | Tragic 83.9% |
| West Indians | 2.4 /100 | #236 | Tragic 83.9% |
| English | 1.8 /100 | #237 | Tragic 83.8% |
| Immigrants | Laos | 1.7 /100 | #238 | Tragic 83.8% |
| Celtics | 1.4 /100 | #239 | Tragic 83.8% |
| Arabs | 1.3 /100 | #240 | Tragic 83.8% |
| Iraqis | 1.3 /100 | #241 | Tragic 83.8% |
| Immigrants | Cambodia | 1.1 /100 | #242 | Tragic 83.8% |
| Immigrants | Western Asia | 1.1 /100 | #243 | Tragic 83.8% |