Zimbabwean vs Arab In Labor Force | Age 35-44
COMPARE
Zimbabwean
Arab
In Labor Force | Age 35-44
In Labor Force | Age 35-44 Comparison
Zimbabweans
Arabs
86.1%
IN LABOR FORCE | AGE 35-44
100.0/ 100
METRIC RATING
5th/ 347
METRIC RANK
83.8%
IN LABOR FORCE | AGE 35-44
1.3/ 100
METRIC RATING
240th/ 347
METRIC RANK
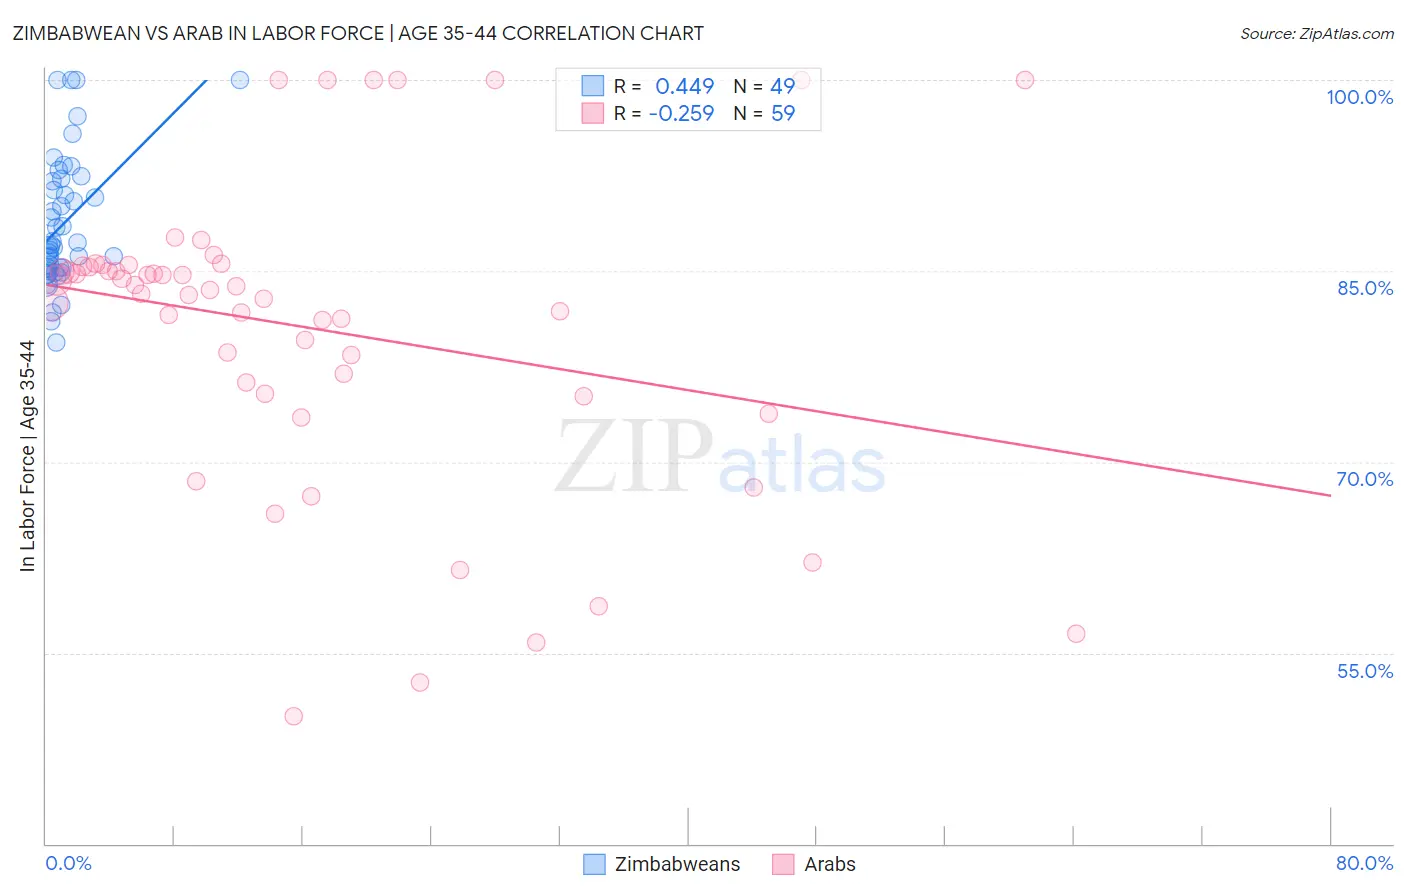
Zimbabwean vs Arab In Labor Force | Age 35-44 Correlation Chart
The statistical analysis conducted on geographies consisting of 69,188,231 people shows a moderate positive correlation between the proportion of Zimbabweans and labor force participation rate among population between the ages 35 and 44 in the United States with a correlation coefficient (R) of 0.449 and weighted average of 86.1%. Similarly, the statistical analysis conducted on geographies consisting of 486,455,192 people shows a weak negative correlation between the proportion of Arabs and labor force participation rate among population between the ages 35 and 44 in the United States with a correlation coefficient (R) of -0.259 and weighted average of 83.8%, a difference of 2.8%.
In Labor Force | Age 35-44 Correlation Summary
| Measurement | Zimbabwean | Arab |
| Minimum | 79.4% | 50.0% |
| Maximum | 100.0% | 100.0% |
| Range | 20.6% | 50.0% |
| Mean | 88.7% | 80.5% |
| Median | 87.0% | 83.5% |
| Interquartile 25% (IQ1) | 85.1% | 75.3% |
| Interquartile 75% (IQ3) | 92.1% | 85.3% |
| Interquartile Range (IQR) | 7.0% | 10.0% |
| Standard Deviation (Sample) | 5.1% | 11.8% |
| Standard Deviation (Population) | 5.0% | 11.7% |
Similar Demographics by In Labor Force | Age 35-44
Demographics Similar to Zimbabweans by In Labor Force | Age 35-44
In terms of in labor force | age 35-44, the demographic groups most similar to Zimbabweans are Bolivian (86.1%, a difference of 0.010%), Immigrants from Sierra Leone (86.1%, a difference of 0.050%), Immigrants from Cabo Verde (86.2%, a difference of 0.13%), Immigrants from Bolivia (86.2%, a difference of 0.16%), and Immigrants from Ethiopia (85.9%, a difference of 0.22%).
| Demographics | Rating | Rank | In Labor Force | Age 35-44 |
| Sierra Leoneans | 100.0 /100 | #1 | Exceptional 86.4% |
| Luxembourgers | 100.0 /100 | #2 | Exceptional 86.4% |
| Immigrants | Bolivia | 100.0 /100 | #3 | Exceptional 86.2% |
| Immigrants | Cabo Verde | 100.0 /100 | #4 | Exceptional 86.2% |
| Zimbabweans | 100.0 /100 | #5 | Exceptional 86.1% |
| Bolivians | 100.0 /100 | #6 | Exceptional 86.1% |
| Immigrants | Sierra Leone | 100.0 /100 | #7 | Exceptional 86.1% |
| Immigrants | Ethiopia | 100.0 /100 | #8 | Exceptional 85.9% |
| Ethiopians | 100.0 /100 | #9 | Exceptional 85.9% |
| Cape Verdeans | 100.0 /100 | #10 | Exceptional 85.8% |
| Immigrants | Cameroon | 100.0 /100 | #11 | Exceptional 85.8% |
| Liberians | 100.0 /100 | #12 | Exceptional 85.7% |
| Somalis | 100.0 /100 | #13 | Exceptional 85.6% |
| Immigrants | Somalia | 100.0 /100 | #14 | Exceptional 85.6% |
| Norwegians | 100.0 /100 | #15 | Exceptional 85.6% |
Demographics Similar to Arabs by In Labor Force | Age 35-44
In terms of in labor force | age 35-44, the demographic groups most similar to Arabs are Celtic (83.8%, a difference of 0.0%), Iraqi (83.8%, a difference of 0.0%), Immigrants from Cambodia (83.8%, a difference of 0.030%), Immigrants from Western Asia (83.8%, a difference of 0.030%), and Guyanese (83.8%, a difference of 0.030%).
| Demographics | Rating | Rank | In Labor Force | Age 35-44 |
| Immigrants | Germany | 2.8 /100 | #233 | Tragic 83.9% |
| Immigrants | Oceania | 2.6 /100 | #234 | Tragic 83.9% |
| Immigrants | Syria | 2.5 /100 | #235 | Tragic 83.9% |
| West Indians | 2.4 /100 | #236 | Tragic 83.9% |
| English | 1.8 /100 | #237 | Tragic 83.8% |
| Immigrants | Laos | 1.7 /100 | #238 | Tragic 83.8% |
| Celtics | 1.4 /100 | #239 | Tragic 83.8% |
| Arabs | 1.3 /100 | #240 | Tragic 83.8% |
| Iraqis | 1.3 /100 | #241 | Tragic 83.8% |
| Immigrants | Cambodia | 1.1 /100 | #242 | Tragic 83.8% |
| Immigrants | Western Asia | 1.1 /100 | #243 | Tragic 83.8% |
| Guyanese | 1.1 /100 | #244 | Tragic 83.8% |
| Malaysians | 1.1 /100 | #245 | Tragic 83.8% |
| Immigrants | Immigrants | 1.0 /100 | #246 | Tragic 83.7% |
| Immigrants | Armenia | 0.9 /100 | #247 | Tragic 83.7% |