Immigrants from China vs Arab Disability Age 65 to 74
COMPARE
Immigrants from China
Arab
Disability Age 65 to 74
Disability Age 65 to 74 Comparison
Immigrants from China
Arabs
20.3%
DISABILITY AGE 65 TO 74
100.0/ 100
METRIC RATING
9th/ 347
METRIC RANK
22.8%
DISABILITY AGE 65 TO 74
84.8/ 100
METRIC RATING
143rd/ 347
METRIC RANK
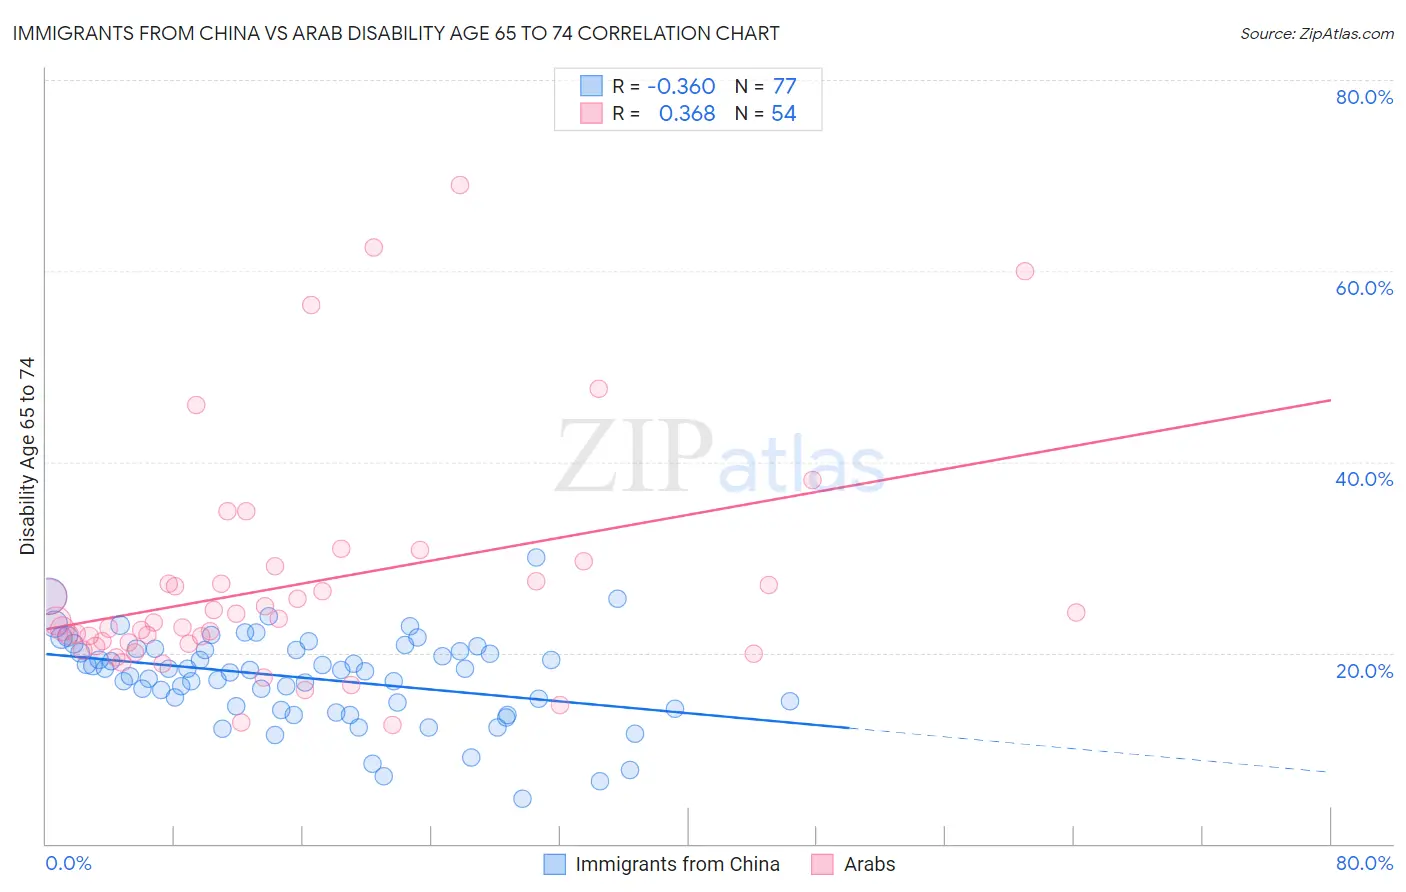
Immigrants from China vs Arab Disability Age 65 to 74 Correlation Chart
The statistical analysis conducted on geographies consisting of 455,755,580 people shows a mild negative correlation between the proportion of Immigrants from China and percentage of population with a disability between the ages 65 and 75 in the United States with a correlation coefficient (R) of -0.360 and weighted average of 20.3%. Similarly, the statistical analysis conducted on geographies consisting of 485,549,986 people shows a mild positive correlation between the proportion of Arabs and percentage of population with a disability between the ages 65 and 75 in the United States with a correlation coefficient (R) of 0.368 and weighted average of 22.8%, a difference of 12.3%.
Disability Age 65 to 74 Correlation Summary
| Measurement | Immigrants from China | Arab |
| Minimum | 4.7% | 12.5% |
| Maximum | 30.0% | 69.0% |
| Range | 25.3% | 56.5% |
| Mean | 17.3% | 27.1% |
| Median | 18.2% | 23.3% |
| Interquartile 25% (IQ1) | 14.3% | 21.0% |
| Interquartile 75% (IQ3) | 20.4% | 27.5% |
| Interquartile Range (IQR) | 6.1% | 6.5% |
| Standard Deviation (Sample) | 4.6% | 12.1% |
| Standard Deviation (Population) | 4.6% | 12.0% |
Similar Demographics by Disability Age 65 to 74
Demographics Similar to Immigrants from China by Disability Age 65 to 74
In terms of disability age 65 to 74, the demographic groups most similar to Immigrants from China are Immigrants from Eastern Asia (20.3%, a difference of 0.070%), Immigrants from Ireland (20.3%, a difference of 0.23%), Immigrants from Korea (20.4%, a difference of 0.45%), Immigrants from Singapore (20.4%, a difference of 0.83%), and Thai (20.1%, a difference of 0.96%).
| Demographics | Rating | Rank | Disability Age 65 to 74 |
| Filipinos | 100.0 /100 | #2 | Exceptional 19.0% |
| Immigrants | India | 100.0 /100 | #3 | Exceptional 19.7% |
| Immigrants | Hong Kong | 100.0 /100 | #4 | Exceptional 19.9% |
| Immigrants | Israel | 100.0 /100 | #5 | Exceptional 19.9% |
| Iranians | 100.0 /100 | #6 | Exceptional 19.9% |
| Cypriots | 100.0 /100 | #7 | Exceptional 20.1% |
| Thais | 100.0 /100 | #8 | Exceptional 20.1% |
| Immigrants | China | 100.0 /100 | #9 | Exceptional 20.3% |
| Immigrants | Eastern Asia | 100.0 /100 | #10 | Exceptional 20.3% |
| Immigrants | Ireland | 100.0 /100 | #11 | Exceptional 20.3% |
| Immigrants | Korea | 100.0 /100 | #12 | Exceptional 20.4% |
| Immigrants | Singapore | 100.0 /100 | #13 | Exceptional 20.4% |
| Indians (Asian) | 100.0 /100 | #14 | Exceptional 20.5% |
| Paraguayans | 100.0 /100 | #15 | Exceptional 20.5% |
| Immigrants | Lithuania | 100.0 /100 | #16 | Exceptional 20.5% |
Demographics Similar to Arabs by Disability Age 65 to 74
In terms of disability age 65 to 74, the demographic groups most similar to Arabs are Danish (22.8%, a difference of 0.040%), Immigrants from Ethiopia (22.7%, a difference of 0.060%), Belgian (22.7%, a difference of 0.070%), Ugandan (22.7%, a difference of 0.080%), and Immigrants from Uganda (22.8%, a difference of 0.080%).
| Demographics | Rating | Rank | Disability Age 65 to 74 |
| Ethiopians | 87.9 /100 | #136 | Excellent 22.7% |
| Taiwanese | 87.6 /100 | #137 | Excellent 22.7% |
| Immigrants | Moldova | 87.3 /100 | #138 | Excellent 22.7% |
| Immigrants | Syria | 85.8 /100 | #139 | Excellent 22.7% |
| Ugandans | 85.4 /100 | #140 | Excellent 22.7% |
| Belgians | 85.3 /100 | #141 | Excellent 22.7% |
| Immigrants | Ethiopia | 85.3 /100 | #142 | Excellent 22.7% |
| Arabs | 84.8 /100 | #143 | Excellent 22.8% |
| Danes | 84.4 /100 | #144 | Excellent 22.8% |
| Immigrants | Uganda | 84.0 /100 | #145 | Excellent 22.8% |
| Alsatians | 83.7 /100 | #146 | Excellent 22.8% |
| Immigrants | Uzbekistan | 83.1 /100 | #147 | Excellent 22.8% |
| New Zealanders | 79.9 /100 | #148 | Good 22.9% |
| Swiss | 79.7 /100 | #149 | Good 22.9% |
| Canadians | 77.7 /100 | #150 | Good 22.9% |