Immigrants from Senegal vs Arab In Labor Force | Age 35-44
COMPARE
Immigrants from Senegal
Arab
In Labor Force | Age 35-44
In Labor Force | Age 35-44 Comparison
Immigrants from Senegal
Arabs
84.4%
IN LABOR FORCE | AGE 35-44
60.4/ 100
METRIC RATING
159th/ 347
METRIC RANK
83.8%
IN LABOR FORCE | AGE 35-44
1.3/ 100
METRIC RATING
240th/ 347
METRIC RANK
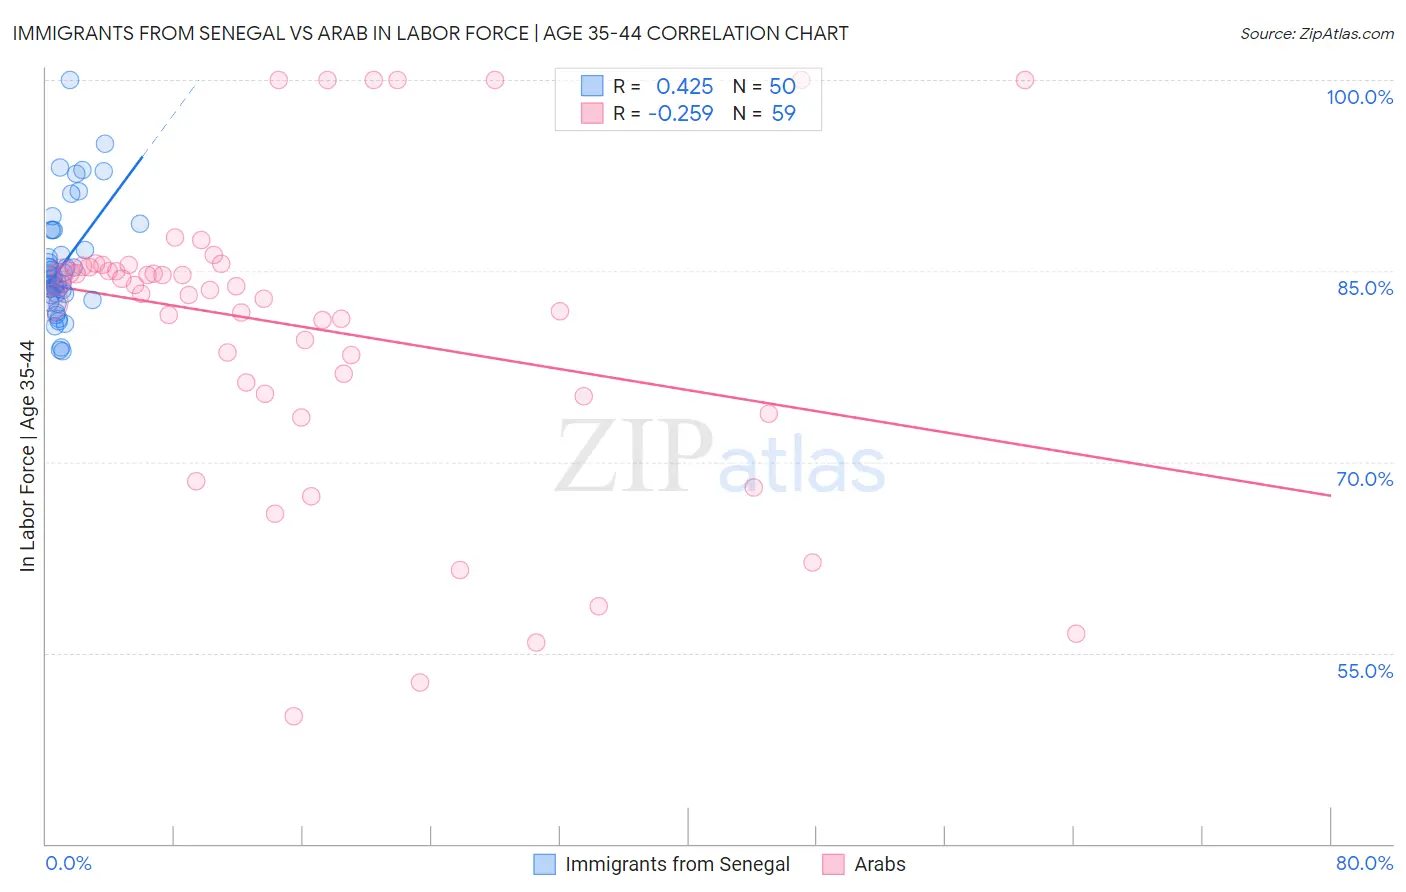
Immigrants from Senegal vs Arab In Labor Force | Age 35-44 Correlation Chart
The statistical analysis conducted on geographies consisting of 90,121,198 people shows a moderate positive correlation between the proportion of Immigrants from Senegal and labor force participation rate among population between the ages 35 and 44 in the United States with a correlation coefficient (R) of 0.425 and weighted average of 84.4%. Similarly, the statistical analysis conducted on geographies consisting of 486,455,192 people shows a weak negative correlation between the proportion of Arabs and labor force participation rate among population between the ages 35 and 44 in the United States with a correlation coefficient (R) of -0.259 and weighted average of 83.8%, a difference of 0.77%.
In Labor Force | Age 35-44 Correlation Summary
| Measurement | Immigrants from Senegal | Arab |
| Minimum | 78.7% | 50.0% |
| Maximum | 100.0% | 100.0% |
| Range | 21.3% | 50.0% |
| Mean | 85.5% | 80.5% |
| Median | 84.5% | 83.5% |
| Interquartile 25% (IQ1) | 83.1% | 75.3% |
| Interquartile 75% (IQ3) | 88.2% | 85.3% |
| Interquartile Range (IQR) | 5.1% | 10.0% |
| Standard Deviation (Sample) | 4.4% | 11.8% |
| Standard Deviation (Population) | 4.4% | 11.7% |
Similar Demographics by In Labor Force | Age 35-44
Demographics Similar to Immigrants from Senegal by In Labor Force | Age 35-44
In terms of in labor force | age 35-44, the demographic groups most similar to Immigrants from Senegal are Immigrants from Kazakhstan (84.4%, a difference of 0.0%), Immigrants from Venezuela (84.4%, a difference of 0.0%), Immigrants from Hungary (84.4%, a difference of 0.010%), Aleut (84.4%, a difference of 0.010%), and Nigerian (84.4%, a difference of 0.010%).
| Demographics | Rating | Rank | In Labor Force | Age 35-44 |
| Immigrants | Taiwan | 71.4 /100 | #152 | Good 84.5% |
| Trinidadians and Tobagonians | 69.5 /100 | #153 | Good 84.5% |
| Iranians | 69.4 /100 | #154 | Good 84.5% |
| Immigrants | Switzerland | 65.9 /100 | #155 | Good 84.5% |
| Immigrants | Israel | 64.3 /100 | #156 | Good 84.4% |
| Immigrants | Austria | 63.8 /100 | #157 | Good 84.4% |
| Jamaicans | 62.7 /100 | #158 | Good 84.4% |
| Immigrants | Senegal | 60.4 /100 | #159 | Good 84.4% |
| Immigrants | Kazakhstan | 60.4 /100 | #160 | Good 84.4% |
| Immigrants | Venezuela | 60.0 /100 | #161 | Good 84.4% |
| Immigrants | Hungary | 59.4 /100 | #162 | Average 84.4% |
| Aleuts | 59.1 /100 | #163 | Average 84.4% |
| Nigerians | 58.9 /100 | #164 | Average 84.4% |
| Venezuelans | 58.1 /100 | #165 | Average 84.4% |
| Alsatians | 55.2 /100 | #166 | Average 84.4% |
Demographics Similar to Arabs by In Labor Force | Age 35-44
In terms of in labor force | age 35-44, the demographic groups most similar to Arabs are Celtic (83.8%, a difference of 0.0%), Iraqi (83.8%, a difference of 0.0%), Immigrants from Cambodia (83.8%, a difference of 0.030%), Immigrants from Western Asia (83.8%, a difference of 0.030%), and Guyanese (83.8%, a difference of 0.030%).
| Demographics | Rating | Rank | In Labor Force | Age 35-44 |
| Immigrants | Germany | 2.8 /100 | #233 | Tragic 83.9% |
| Immigrants | Oceania | 2.6 /100 | #234 | Tragic 83.9% |
| Immigrants | Syria | 2.5 /100 | #235 | Tragic 83.9% |
| West Indians | 2.4 /100 | #236 | Tragic 83.9% |
| English | 1.8 /100 | #237 | Tragic 83.8% |
| Immigrants | Laos | 1.7 /100 | #238 | Tragic 83.8% |
| Celtics | 1.4 /100 | #239 | Tragic 83.8% |
| Arabs | 1.3 /100 | #240 | Tragic 83.8% |
| Iraqis | 1.3 /100 | #241 | Tragic 83.8% |
| Immigrants | Cambodia | 1.1 /100 | #242 | Tragic 83.8% |
| Immigrants | Western Asia | 1.1 /100 | #243 | Tragic 83.8% |
| Guyanese | 1.1 /100 | #244 | Tragic 83.8% |
| Malaysians | 1.1 /100 | #245 | Tragic 83.8% |
| Immigrants | Immigrants | 1.0 /100 | #246 | Tragic 83.7% |
| Immigrants | Armenia | 0.9 /100 | #247 | Tragic 83.7% |