Immigrants from China vs British In Labor Force | Age 35-44
COMPARE
Immigrants from China
British
In Labor Force | Age 35-44
In Labor Force | Age 35-44 Comparison
Immigrants from China
British
84.7%
IN LABOR FORCE | AGE 35-44
92.3/ 100
METRIC RATING
117th/ 347
METRIC RANK
84.2%
IN LABOR FORCE | AGE 35-44
23.0/ 100
METRIC RATING
201st/ 347
METRIC RANK
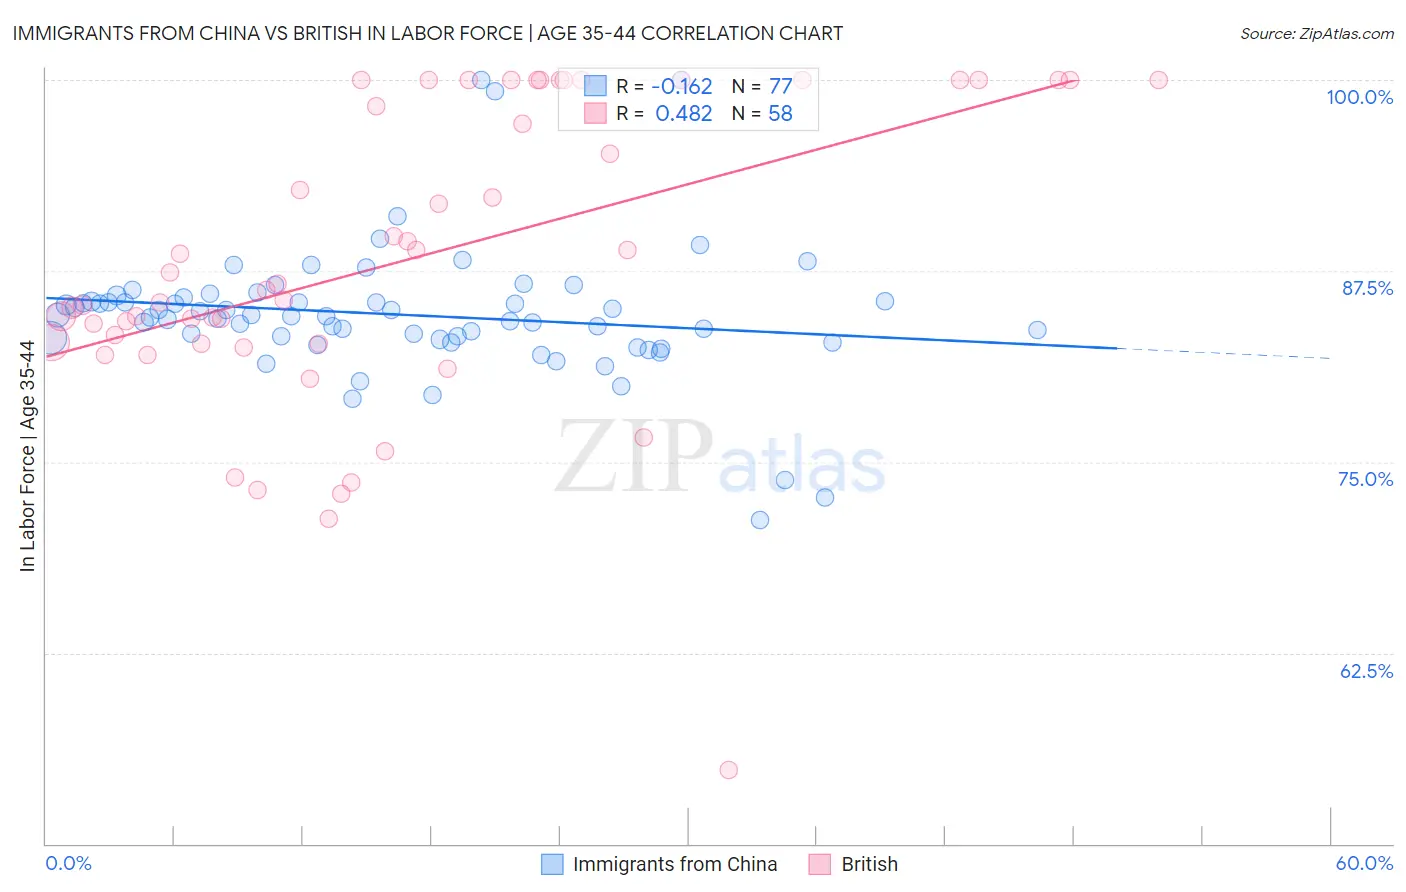
Immigrants from China vs British In Labor Force | Age 35-44 Correlation Chart
The statistical analysis conducted on geographies consisting of 456,678,998 people shows a poor negative correlation between the proportion of Immigrants from China and labor force participation rate among population between the ages 35 and 44 in the United States with a correlation coefficient (R) of -0.162 and weighted average of 84.7%. Similarly, the statistical analysis conducted on geographies consisting of 531,027,456 people shows a moderate positive correlation between the proportion of British and labor force participation rate among population between the ages 35 and 44 in the United States with a correlation coefficient (R) of 0.482 and weighted average of 84.2%, a difference of 0.60%.
In Labor Force | Age 35-44 Correlation Summary
| Measurement | Immigrants from China | British |
| Minimum | 71.2% | 54.8% |
| Maximum | 100.0% | 100.0% |
| Range | 28.8% | 45.2% |
| Mean | 84.6% | 88.2% |
| Median | 84.5% | 86.4% |
| Interquartile 25% (IQ1) | 83.1% | 82.8% |
| Interquartile 75% (IQ3) | 85.6% | 100.0% |
| Interquartile Range (IQR) | 2.5% | 17.2% |
| Standard Deviation (Sample) | 4.4% | 9.9% |
| Standard Deviation (Population) | 4.4% | 9.8% |
Similar Demographics by In Labor Force | Age 35-44
Demographics Similar to Immigrants from China by In Labor Force | Age 35-44
In terms of in labor force | age 35-44, the demographic groups most similar to Immigrants from China are Immigrants from Eastern Asia (84.7%, a difference of 0.0%), Immigrants from Egypt (84.7%, a difference of 0.010%), Burmese (84.7%, a difference of 0.010%), Uruguayan (84.7%, a difference of 0.020%), and Chilean (84.7%, a difference of 0.020%).
| Demographics | Rating | Rank | In Labor Force | Age 35-44 |
| Filipinos | 93.8 /100 | #110 | Exceptional 84.7% |
| Ukrainians | 93.5 /100 | #111 | Exceptional 84.7% |
| Immigrants | Western Africa | 93.4 /100 | #112 | Exceptional 84.7% |
| Uruguayans | 93.3 /100 | #113 | Exceptional 84.7% |
| Chileans | 93.2 /100 | #114 | Exceptional 84.7% |
| Bahamians | 93.2 /100 | #115 | Exceptional 84.7% |
| Immigrants | Egypt | 92.7 /100 | #116 | Exceptional 84.7% |
| Immigrants | China | 92.3 /100 | #117 | Exceptional 84.7% |
| Immigrants | Eastern Asia | 92.1 /100 | #118 | Exceptional 84.7% |
| Burmese | 91.8 /100 | #119 | Exceptional 84.7% |
| Immigrants | Northern Europe | 91.5 /100 | #120 | Exceptional 84.7% |
| Finns | 91.2 /100 | #121 | Exceptional 84.7% |
| Germans | 91.0 /100 | #122 | Exceptional 84.7% |
| Immigrants | South America | 90.9 /100 | #123 | Exceptional 84.7% |
| Slavs | 90.8 /100 | #124 | Exceptional 84.7% |
Demographics Similar to British by In Labor Force | Age 35-44
In terms of in labor force | age 35-44, the demographic groups most similar to British are Syrian (84.2%, a difference of 0.0%), Moroccan (84.2%, a difference of 0.0%), Immigrants from Uzbekistan (84.2%, a difference of 0.0%), Ecuadorian (84.2%, a difference of 0.010%), and Immigrants from South Eastern Asia (84.2%, a difference of 0.010%).
| Demographics | Rating | Rank | In Labor Force | Age 35-44 |
| Immigrants | Indonesia | 25.7 /100 | #194 | Fair 84.2% |
| Immigrants | Caribbean | 25.7 /100 | #195 | Fair 84.2% |
| Immigrants | England | 25.0 /100 | #196 | Fair 84.2% |
| Immigrants | Western Europe | 24.7 /100 | #197 | Fair 84.2% |
| Ecuadorians | 24.0 /100 | #198 | Fair 84.2% |
| Syrians | 23.2 /100 | #199 | Fair 84.2% |
| Moroccans | 23.2 /100 | #200 | Fair 84.2% |
| British | 23.0 /100 | #201 | Fair 84.2% |
| Immigrants | Uzbekistan | 22.8 /100 | #202 | Fair 84.2% |
| Immigrants | South Eastern Asia | 22.4 /100 | #203 | Fair 84.2% |
| Canadians | 19.9 /100 | #204 | Poor 84.2% |
| Immigrants | Canada | 19.6 /100 | #205 | Poor 84.2% |
| Immigrants | Costa Rica | 19.5 /100 | #206 | Poor 84.2% |
| Laotians | 19.0 /100 | #207 | Poor 84.2% |
| Immigrants | North America | 18.1 /100 | #208 | Poor 84.2% |