Swedish vs Arab In Labor Force | Age 35-44
COMPARE
Swedish
Arab
In Labor Force | Age 35-44
In Labor Force | Age 35-44 Comparison
Swedes
Arabs
85.0%
IN LABOR FORCE | AGE 35-44
99.2/ 100
METRIC RATING
64th/ 347
METRIC RANK
83.8%
IN LABOR FORCE | AGE 35-44
1.3/ 100
METRIC RATING
240th/ 347
METRIC RANK
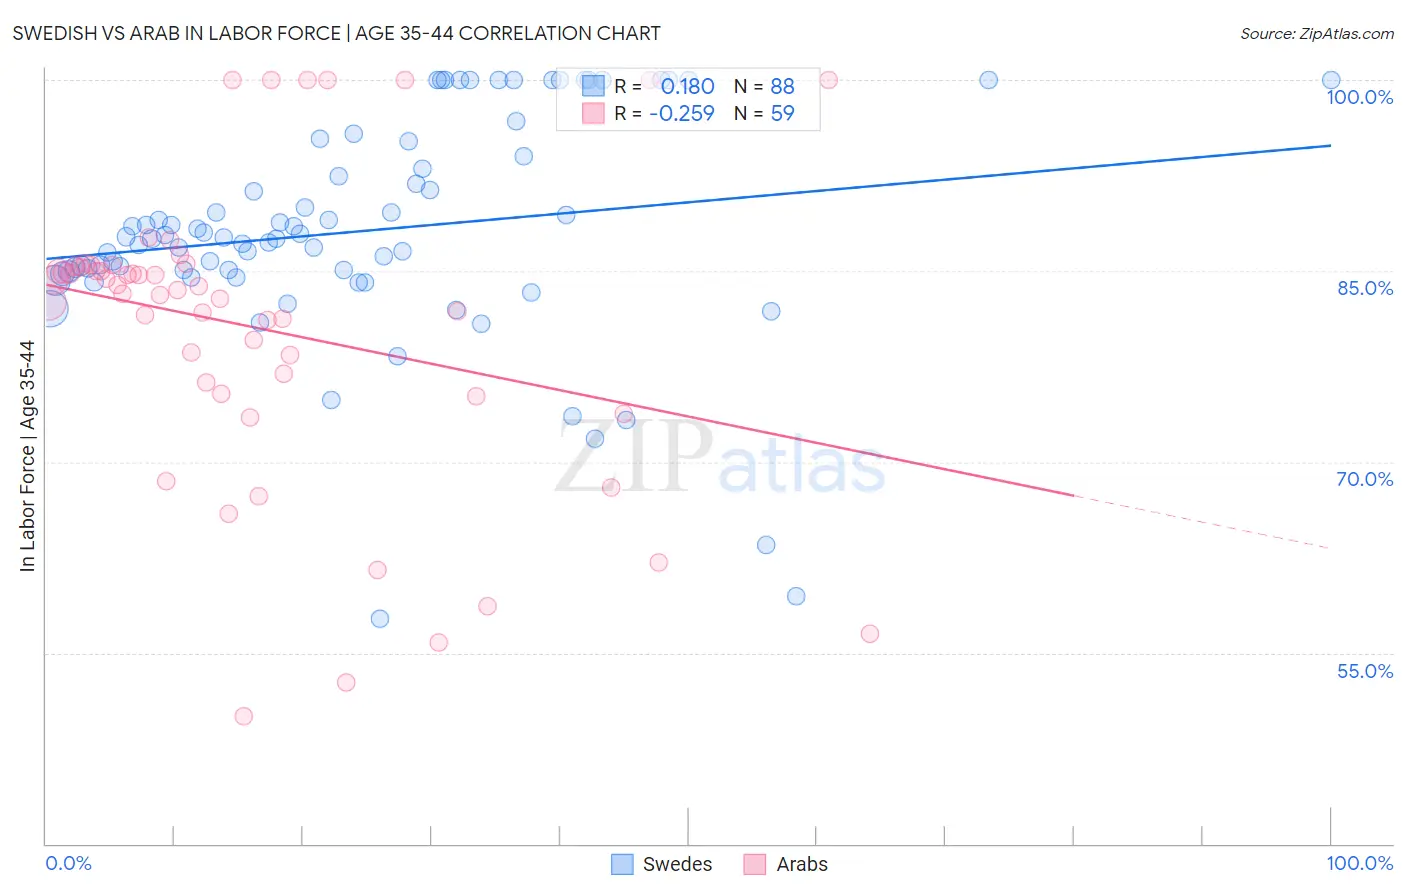
Swedish vs Arab In Labor Force | Age 35-44 Correlation Chart
The statistical analysis conducted on geographies consisting of 538,724,566 people shows a poor positive correlation between the proportion of Swedes and labor force participation rate among population between the ages 35 and 44 in the United States with a correlation coefficient (R) of 0.180 and weighted average of 85.0%. Similarly, the statistical analysis conducted on geographies consisting of 486,455,192 people shows a weak negative correlation between the proportion of Arabs and labor force participation rate among population between the ages 35 and 44 in the United States with a correlation coefficient (R) of -0.259 and weighted average of 83.8%, a difference of 1.5%.
In Labor Force | Age 35-44 Correlation Summary
| Measurement | Swedish | Arab |
| Minimum | 57.7% | 50.0% |
| Maximum | 100.0% | 100.0% |
| Range | 42.3% | 50.0% |
| Mean | 88.1% | 80.5% |
| Median | 87.6% | 83.5% |
| Interquartile 25% (IQ1) | 84.9% | 75.3% |
| Interquartile 75% (IQ3) | 93.5% | 85.3% |
| Interquartile Range (IQR) | 8.6% | 10.0% |
| Standard Deviation (Sample) | 8.7% | 11.8% |
| Standard Deviation (Population) | 8.6% | 11.7% |
Similar Demographics by In Labor Force | Age 35-44
Demographics Similar to Swedes by In Labor Force | Age 35-44
In terms of in labor force | age 35-44, the demographic groups most similar to Swedes are Immigrants from Moldova (85.0%, a difference of 0.010%), Immigrants from Uganda (85.0%, a difference of 0.010%), Immigrants from Brazil (85.0%, a difference of 0.010%), Immigrants from Latvia (85.0%, a difference of 0.020%), and Immigrants from Haiti (85.0%, a difference of 0.020%).
| Demographics | Rating | Rank | In Labor Force | Age 35-44 |
| Chinese | 99.4 /100 | #57 | Exceptional 85.1% |
| Slovaks | 99.4 /100 | #58 | Exceptional 85.1% |
| Serbians | 99.4 /100 | #59 | Exceptional 85.1% |
| Albanians | 99.4 /100 | #60 | Exceptional 85.1% |
| Immigrants | Latvia | 99.3 /100 | #61 | Exceptional 85.0% |
| Immigrants | Moldova | 99.3 /100 | #62 | Exceptional 85.0% |
| Immigrants | Uganda | 99.3 /100 | #63 | Exceptional 85.0% |
| Swedes | 99.2 /100 | #64 | Exceptional 85.0% |
| Immigrants | Brazil | 99.2 /100 | #65 | Exceptional 85.0% |
| Immigrants | Haiti | 99.1 /100 | #66 | Exceptional 85.0% |
| Immigrants | Italy | 99.1 /100 | #67 | Exceptional 85.0% |
| Italians | 99.1 /100 | #68 | Exceptional 85.0% |
| Sudanese | 99.0 /100 | #69 | Exceptional 85.0% |
| Brazilians | 99.0 /100 | #70 | Exceptional 85.0% |
| Russians | 99.0 /100 | #71 | Exceptional 85.0% |
Demographics Similar to Arabs by In Labor Force | Age 35-44
In terms of in labor force | age 35-44, the demographic groups most similar to Arabs are Celtic (83.8%, a difference of 0.0%), Iraqi (83.8%, a difference of 0.0%), Immigrants from Cambodia (83.8%, a difference of 0.030%), Immigrants from Western Asia (83.8%, a difference of 0.030%), and Guyanese (83.8%, a difference of 0.030%).
| Demographics | Rating | Rank | In Labor Force | Age 35-44 |
| Immigrants | Germany | 2.8 /100 | #233 | Tragic 83.9% |
| Immigrants | Oceania | 2.6 /100 | #234 | Tragic 83.9% |
| Immigrants | Syria | 2.5 /100 | #235 | Tragic 83.9% |
| West Indians | 2.4 /100 | #236 | Tragic 83.9% |
| English | 1.8 /100 | #237 | Tragic 83.8% |
| Immigrants | Laos | 1.7 /100 | #238 | Tragic 83.8% |
| Celtics | 1.4 /100 | #239 | Tragic 83.8% |
| Arabs | 1.3 /100 | #240 | Tragic 83.8% |
| Iraqis | 1.3 /100 | #241 | Tragic 83.8% |
| Immigrants | Cambodia | 1.1 /100 | #242 | Tragic 83.8% |
| Immigrants | Western Asia | 1.1 /100 | #243 | Tragic 83.8% |
| Guyanese | 1.1 /100 | #244 | Tragic 83.8% |
| Malaysians | 1.1 /100 | #245 | Tragic 83.8% |
| Immigrants | Immigrants | 1.0 /100 | #246 | Tragic 83.7% |
| Immigrants | Armenia | 0.9 /100 | #247 | Tragic 83.7% |