Immigrants from Chile vs Immigrants from Somalia In Labor Force | Age > 16
COMPARE
Immigrants from Chile
Immigrants from Somalia
In Labor Force | Age > 16
In Labor Force | Age > 16 Comparison
Immigrants from Chile
Immigrants from Somalia
65.9%
IN LABOR FORCE | AGE > 16
98.7/ 100
METRIC RATING
98th/ 347
METRIC RANK
69.1%
IN LABOR FORCE | AGE > 16
100.0/ 100
METRIC RATING
4th/ 347
METRIC RANK
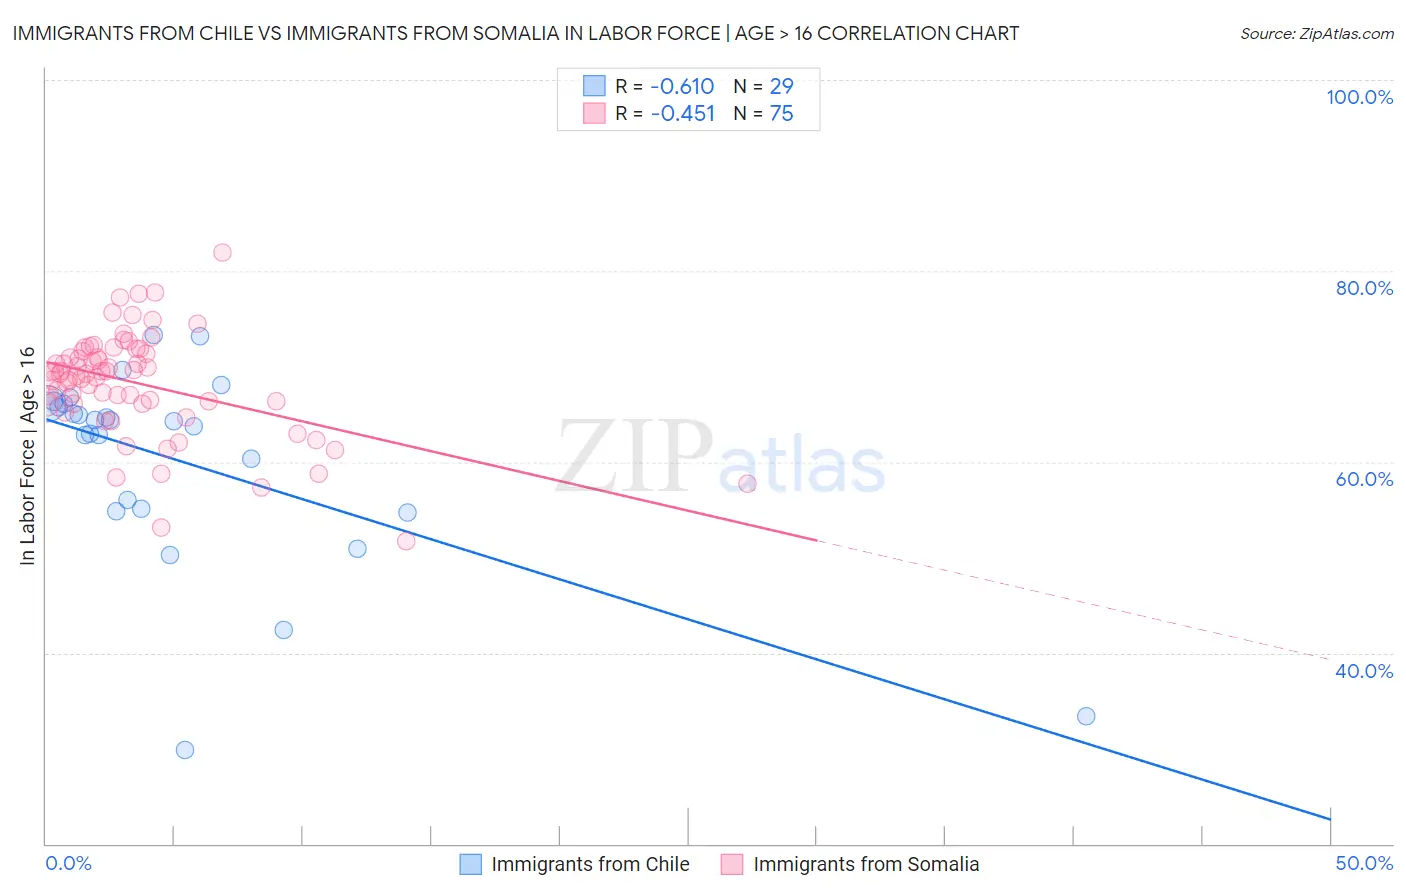
Immigrants from Chile vs Immigrants from Somalia In Labor Force | Age > 16 Correlation Chart
The statistical analysis conducted on geographies consisting of 218,647,266 people shows a significant negative correlation between the proportion of Immigrants from Chile and labor force participation rate among population ages 16 and over in the United States with a correlation coefficient (R) of -0.610 and weighted average of 65.9%. Similarly, the statistical analysis conducted on geographies consisting of 92,107,842 people shows a moderate negative correlation between the proportion of Immigrants from Somalia and labor force participation rate among population ages 16 and over in the United States with a correlation coefficient (R) of -0.451 and weighted average of 69.1%, a difference of 4.9%.
In Labor Force | Age > 16 Correlation Summary
| Measurement | Immigrants from Chile | Immigrants from Somalia |
| Minimum | 29.8% | 51.7% |
| Maximum | 73.3% | 81.9% |
| Range | 43.5% | 30.2% |
| Mean | 60.1% | 68.2% |
| Median | 64.2% | 69.2% |
| Interquartile 25% (IQ1) | 55.0% | 66.1% |
| Interquartile 75% (IQ3) | 66.1% | 71.6% |
| Interquartile Range (IQR) | 11.1% | 5.5% |
| Standard Deviation (Sample) | 10.5% | 5.5% |
| Standard Deviation (Population) | 10.3% | 5.5% |
Similar Demographics by In Labor Force | Age > 16
Demographics Similar to Immigrants from Chile by In Labor Force | Age > 16
In terms of in labor force | age > 16, the demographic groups most similar to Immigrants from Chile are Immigrants from Australia (65.9%, a difference of 0.010%), Okinawan (65.9%, a difference of 0.020%), Immigrants from Colombia (65.9%, a difference of 0.020%), Uruguayan (65.9%, a difference of 0.020%), and Filipino (65.9%, a difference of 0.030%).
| Demographics | Rating | Rank | In Labor Force | Age > 16 |
| Iranians | 99.2 /100 | #91 | Exceptional 66.0% |
| Aleuts | 99.1 /100 | #92 | Exceptional 66.0% |
| Immigrants | South America | 99.1 /100 | #93 | Exceptional 66.0% |
| Immigrants | Cambodia | 99.1 /100 | #94 | Exceptional 66.0% |
| Immigrants | Uruguay | 99.1 /100 | #95 | Exceptional 66.0% |
| Bangladeshis | 98.9 /100 | #96 | Exceptional 65.9% |
| Filipinos | 98.9 /100 | #97 | Exceptional 65.9% |
| Immigrants | Chile | 98.7 /100 | #98 | Exceptional 65.9% |
| Immigrants | Australia | 98.7 /100 | #99 | Exceptional 65.9% |
| Okinawans | 98.7 /100 | #100 | Exceptional 65.9% |
| Immigrants | Colombia | 98.6 /100 | #101 | Exceptional 65.9% |
| Uruguayans | 98.6 /100 | #102 | Exceptional 65.9% |
| Immigrants | South Eastern Asia | 98.5 /100 | #103 | Exceptional 65.9% |
| Palestinians | 98.5 /100 | #104 | Exceptional 65.9% |
| Colombians | 98.4 /100 | #105 | Exceptional 65.9% |
Demographics Similar to Immigrants from Somalia by In Labor Force | Age > 16
In terms of in labor force | age > 16, the demographic groups most similar to Immigrants from Somalia are Somali (69.2%, a difference of 0.070%), Ethiopian (69.3%, a difference of 0.27%), Sierra Leonean (68.9%, a difference of 0.31%), Immigrants from Eritrea (68.9%, a difference of 0.36%), and Immigrants from Ethiopia (69.4%, a difference of 0.44%).
| Demographics | Rating | Rank | In Labor Force | Age > 16 |
| Immigrants | Ethiopia | 100.0 /100 | #1 | Exceptional 69.4% |
| Ethiopians | 100.0 /100 | #2 | Exceptional 69.3% |
| Somalis | 100.0 /100 | #3 | Exceptional 69.2% |
| Immigrants | Somalia | 100.0 /100 | #4 | Exceptional 69.1% |
| Sierra Leoneans | 100.0 /100 | #5 | Exceptional 68.9% |
| Immigrants | Eritrea | 100.0 /100 | #6 | Exceptional 68.9% |
| Immigrants | Cameroon | 100.0 /100 | #7 | Exceptional 68.7% |
| Immigrants | Sierra Leone | 100.0 /100 | #8 | Exceptional 68.5% |
| Immigrants | Eastern Africa | 100.0 /100 | #9 | Exceptional 68.5% |
| Immigrants | Bolivia | 100.0 /100 | #10 | Exceptional 68.4% |
| Bolivians | 100.0 /100 | #11 | Exceptional 68.2% |
| Sudanese | 100.0 /100 | #12 | Exceptional 68.0% |
| Immigrants | Nepal | 100.0 /100 | #13 | Exceptional 68.0% |
| Liberians | 100.0 /100 | #14 | Exceptional 67.8% |
| Immigrants | Middle Africa | 100.0 /100 | #15 | Exceptional 67.7% |