Immigrants from Chile vs Salvadoran In Labor Force | Age > 16
COMPARE
Immigrants from Chile
Salvadoran
In Labor Force | Age > 16
In Labor Force | Age > 16 Comparison
Immigrants from Chile
Salvadorans
65.9%
IN LABOR FORCE | AGE > 16
98.7/ 100
METRIC RATING
98th/ 347
METRIC RANK
66.8%
IN LABOR FORCE | AGE > 16
100.0/ 100
METRIC RATING
39th/ 347
METRIC RANK
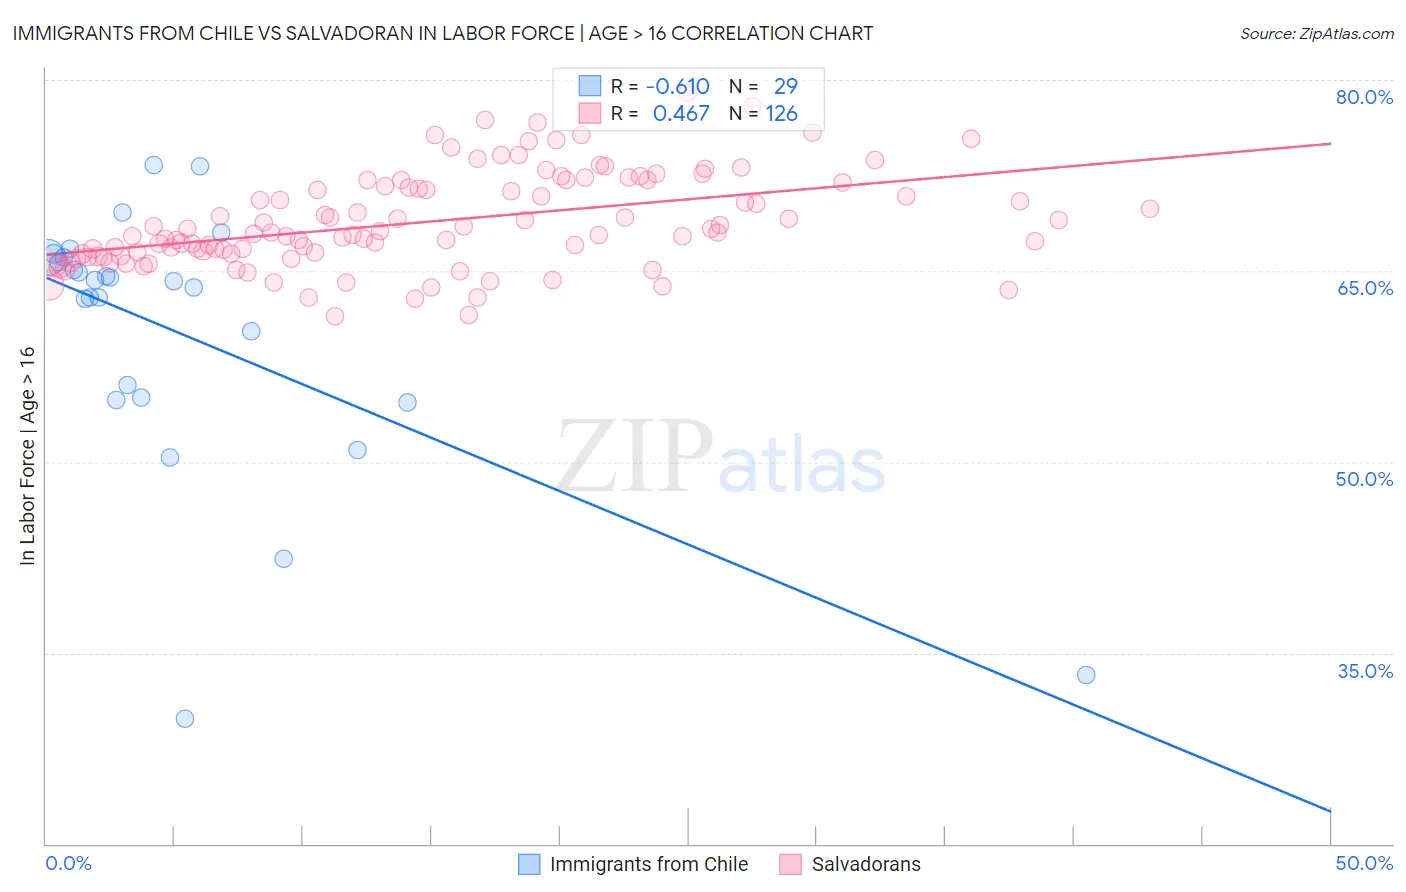
Immigrants from Chile vs Salvadoran In Labor Force | Age > 16 Correlation Chart
The statistical analysis conducted on geographies consisting of 218,647,266 people shows a significant negative correlation between the proportion of Immigrants from Chile and labor force participation rate among population ages 16 and over in the United States with a correlation coefficient (R) of -0.610 and weighted average of 65.9%. Similarly, the statistical analysis conducted on geographies consisting of 399,019,559 people shows a moderate positive correlation between the proportion of Salvadorans and labor force participation rate among population ages 16 and over in the United States with a correlation coefficient (R) of 0.467 and weighted average of 66.8%, a difference of 1.4%.
In Labor Force | Age > 16 Correlation Summary
| Measurement | Immigrants from Chile | Salvadoran |
| Minimum | 29.8% | 61.5% |
| Maximum | 73.3% | 79.0% |
| Range | 43.5% | 17.5% |
| Mean | 60.1% | 68.9% |
| Median | 64.2% | 67.9% |
| Interquartile 25% (IQ1) | 55.0% | 66.3% |
| Interquartile 75% (IQ3) | 66.1% | 71.7% |
| Interquartile Range (IQR) | 11.1% | 5.4% |
| Standard Deviation (Sample) | 10.5% | 3.7% |
| Standard Deviation (Population) | 10.3% | 3.7% |
Similar Demographics by In Labor Force | Age > 16
Demographics Similar to Immigrants from Chile by In Labor Force | Age > 16
In terms of in labor force | age > 16, the demographic groups most similar to Immigrants from Chile are Immigrants from Australia (65.9%, a difference of 0.010%), Okinawan (65.9%, a difference of 0.020%), Immigrants from Colombia (65.9%, a difference of 0.020%), Uruguayan (65.9%, a difference of 0.020%), and Filipino (65.9%, a difference of 0.030%).
| Demographics | Rating | Rank | In Labor Force | Age > 16 |
| Iranians | 99.2 /100 | #91 | Exceptional 66.0% |
| Aleuts | 99.1 /100 | #92 | Exceptional 66.0% |
| Immigrants | South America | 99.1 /100 | #93 | Exceptional 66.0% |
| Immigrants | Cambodia | 99.1 /100 | #94 | Exceptional 66.0% |
| Immigrants | Uruguay | 99.1 /100 | #95 | Exceptional 66.0% |
| Bangladeshis | 98.9 /100 | #96 | Exceptional 65.9% |
| Filipinos | 98.9 /100 | #97 | Exceptional 65.9% |
| Immigrants | Chile | 98.7 /100 | #98 | Exceptional 65.9% |
| Immigrants | Australia | 98.7 /100 | #99 | Exceptional 65.9% |
| Okinawans | 98.7 /100 | #100 | Exceptional 65.9% |
| Immigrants | Colombia | 98.6 /100 | #101 | Exceptional 65.9% |
| Uruguayans | 98.6 /100 | #102 | Exceptional 65.9% |
| Immigrants | South Eastern Asia | 98.5 /100 | #103 | Exceptional 65.9% |
| Palestinians | 98.5 /100 | #104 | Exceptional 65.9% |
| Colombians | 98.4 /100 | #105 | Exceptional 65.9% |
Demographics Similar to Salvadorans by In Labor Force | Age > 16
In terms of in labor force | age > 16, the demographic groups most similar to Salvadorans are Immigrants from El Salvador (66.8%, a difference of 0.020%), Immigrants from Zimbabwe (66.8%, a difference of 0.020%), Senegalese (66.7%, a difference of 0.11%), Luxembourger (66.7%, a difference of 0.14%), and Immigrants from Nigeria (66.9%, a difference of 0.16%).
| Demographics | Rating | Rank | In Labor Force | Age > 16 |
| Immigrants | Congo | 100.0 /100 | #32 | Exceptional 67.1% |
| Afghans | 100.0 /100 | #33 | Exceptional 67.1% |
| Immigrants | Ghana | 100.0 /100 | #34 | Exceptional 67.1% |
| Immigrants | South Central Asia | 100.0 /100 | #35 | Exceptional 67.1% |
| Immigrants | Western Africa | 100.0 /100 | #36 | Exceptional 67.1% |
| Immigrants | Afghanistan | 100.0 /100 | #37 | Exceptional 67.0% |
| Immigrants | Nigeria | 100.0 /100 | #38 | Exceptional 66.9% |
| Salvadorans | 100.0 /100 | #39 | Exceptional 66.8% |
| Immigrants | El Salvador | 100.0 /100 | #40 | Exceptional 66.8% |
| Immigrants | Zimbabwe | 100.0 /100 | #41 | Exceptional 66.8% |
| Senegalese | 100.0 /100 | #42 | Exceptional 66.7% |
| Luxembourgers | 100.0 /100 | #43 | Exceptional 66.7% |
| Immigrants | Pakistan | 100.0 /100 | #44 | Exceptional 66.7% |
| Immigrants | Brazil | 100.0 /100 | #45 | Exceptional 66.7% |
| Brazilians | 100.0 /100 | #46 | Exceptional 66.6% |