Immigrants from Chile vs Jamaican In Labor Force | Age > 16
COMPARE
Immigrants from Chile
Jamaican
In Labor Force | Age > 16
In Labor Force | Age > 16 Comparison
Immigrants from Chile
Jamaicans
65.9%
IN LABOR FORCE | AGE > 16
98.7/ 100
METRIC RATING
98th/ 347
METRIC RANK
64.9%
IN LABOR FORCE | AGE > 16
18.7/ 100
METRIC RATING
205th/ 347
METRIC RANK
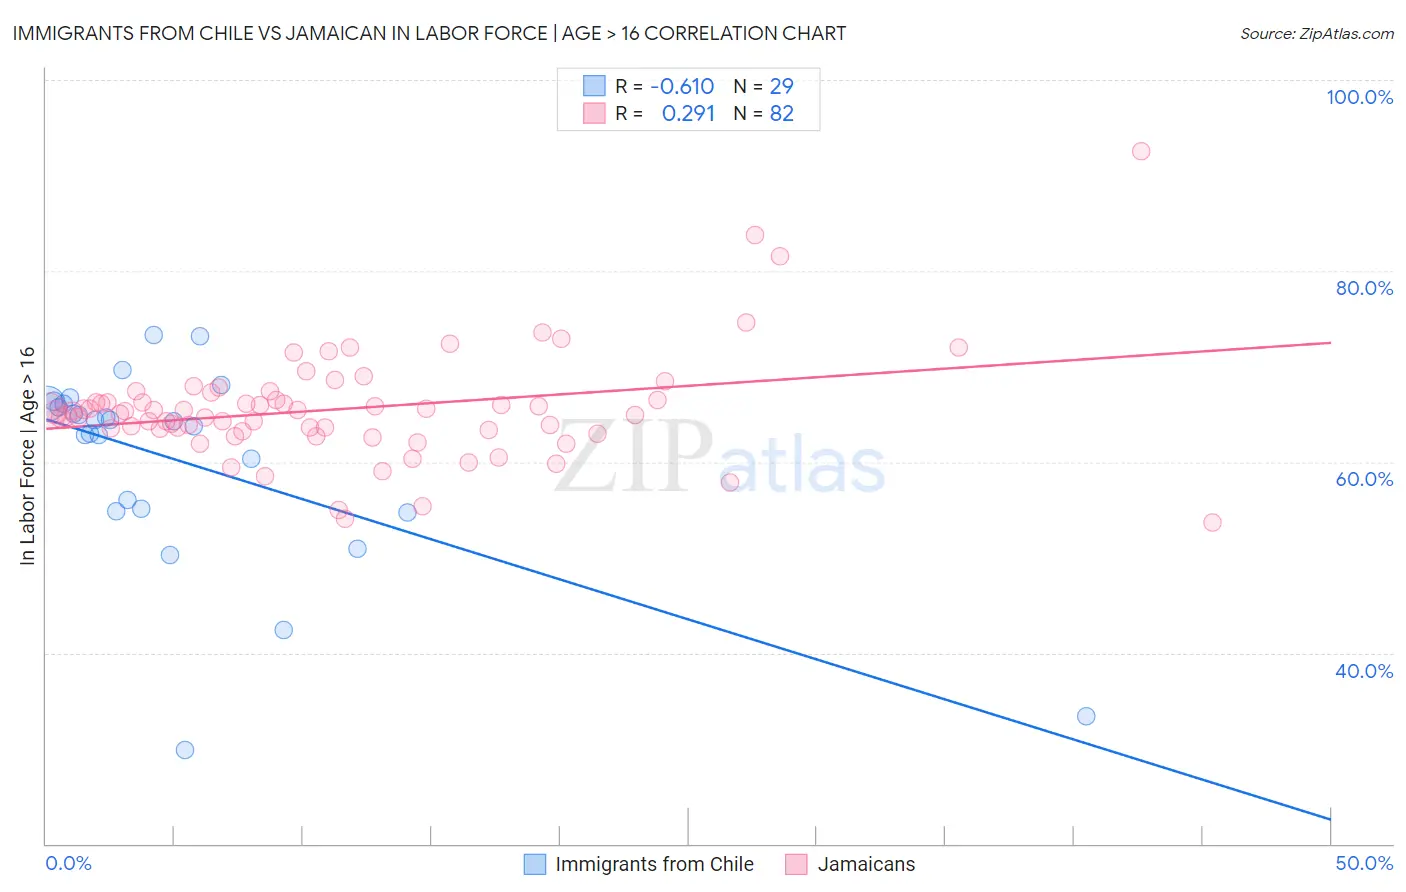
Immigrants from Chile vs Jamaican In Labor Force | Age > 16 Correlation Chart
The statistical analysis conducted on geographies consisting of 218,647,266 people shows a significant negative correlation between the proportion of Immigrants from Chile and labor force participation rate among population ages 16 and over in the United States with a correlation coefficient (R) of -0.610 and weighted average of 65.9%. Similarly, the statistical analysis conducted on geographies consisting of 368,080,959 people shows a weak positive correlation between the proportion of Jamaicans and labor force participation rate among population ages 16 and over in the United States with a correlation coefficient (R) of 0.291 and weighted average of 64.9%, a difference of 1.6%.
In Labor Force | Age > 16 Correlation Summary
| Measurement | Immigrants from Chile | Jamaican |
| Minimum | 29.8% | 53.6% |
| Maximum | 73.3% | 92.6% |
| Range | 43.5% | 39.0% |
| Mean | 60.1% | 65.5% |
| Median | 64.2% | 65.2% |
| Interquartile 25% (IQ1) | 55.0% | 63.4% |
| Interquartile 75% (IQ3) | 66.1% | 66.5% |
| Interquartile Range (IQR) | 11.1% | 3.1% |
| Standard Deviation (Sample) | 10.5% | 5.8% |
| Standard Deviation (Population) | 10.3% | 5.8% |
Similar Demographics by In Labor Force | Age > 16
Demographics Similar to Immigrants from Chile by In Labor Force | Age > 16
In terms of in labor force | age > 16, the demographic groups most similar to Immigrants from Chile are Immigrants from Australia (65.9%, a difference of 0.010%), Okinawan (65.9%, a difference of 0.020%), Immigrants from Colombia (65.9%, a difference of 0.020%), Uruguayan (65.9%, a difference of 0.020%), and Filipino (65.9%, a difference of 0.030%).
| Demographics | Rating | Rank | In Labor Force | Age > 16 |
| Iranians | 99.2 /100 | #91 | Exceptional 66.0% |
| Aleuts | 99.1 /100 | #92 | Exceptional 66.0% |
| Immigrants | South America | 99.1 /100 | #93 | Exceptional 66.0% |
| Immigrants | Cambodia | 99.1 /100 | #94 | Exceptional 66.0% |
| Immigrants | Uruguay | 99.1 /100 | #95 | Exceptional 66.0% |
| Bangladeshis | 98.9 /100 | #96 | Exceptional 65.9% |
| Filipinos | 98.9 /100 | #97 | Exceptional 65.9% |
| Immigrants | Chile | 98.7 /100 | #98 | Exceptional 65.9% |
| Immigrants | Australia | 98.7 /100 | #99 | Exceptional 65.9% |
| Okinawans | 98.7 /100 | #100 | Exceptional 65.9% |
| Immigrants | Colombia | 98.6 /100 | #101 | Exceptional 65.9% |
| Uruguayans | 98.6 /100 | #102 | Exceptional 65.9% |
| Immigrants | South Eastern Asia | 98.5 /100 | #103 | Exceptional 65.9% |
| Palestinians | 98.5 /100 | #104 | Exceptional 65.9% |
| Colombians | 98.4 /100 | #105 | Exceptional 65.9% |
Demographics Similar to Jamaicans by In Labor Force | Age > 16
In terms of in labor force | age > 16, the demographic groups most similar to Jamaicans are Russian (64.9%, a difference of 0.0%), Slovene (64.9%, a difference of 0.0%), Immigrants from Belgium (64.9%, a difference of 0.010%), Ukrainian (64.9%, a difference of 0.020%), and Armenian (64.9%, a difference of 0.030%).
| Demographics | Rating | Rank | In Labor Force | Age > 16 |
| Greeks | 26.1 /100 | #198 | Fair 64.9% |
| Mexican American Indians | 23.1 /100 | #199 | Fair 64.9% |
| Armenians | 20.2 /100 | #200 | Fair 64.9% |
| Ukrainians | 19.6 /100 | #201 | Poor 64.9% |
| Immigrants | Belgium | 19.4 /100 | #202 | Poor 64.9% |
| Russians | 18.8 /100 | #203 | Poor 64.9% |
| Slovenes | 18.7 /100 | #204 | Poor 64.9% |
| Jamaicans | 18.7 /100 | #205 | Poor 64.9% |
| Lithuanians | 17.4 /100 | #206 | Poor 64.8% |
| Immigrants | Latin America | 16.4 /100 | #207 | Poor 64.8% |
| Belizeans | 16.2 /100 | #208 | Poor 64.8% |
| Immigrants | Trinidad and Tobago | 15.6 /100 | #209 | Poor 64.8% |
| Immigrants | Denmark | 14.7 /100 | #210 | Poor 64.8% |
| Fijians | 14.1 /100 | #211 | Poor 64.8% |
| Alaskan Athabascans | 13.9 /100 | #212 | Poor 64.8% |