Immigrants from Chile vs Immigrants from Somalia Nursery School
COMPARE
Immigrants from Chile
Immigrants from Somalia
Nursery School
Nursery School Comparison
Immigrants from Chile
Immigrants from Somalia
97.9%
NURSERY SCHOOL
17.3/ 100
METRIC RATING
205th/ 347
METRIC RANK
97.0%
NURSERY SCHOOL
0.0/ 100
METRIC RATING
309th/ 347
METRIC RANK
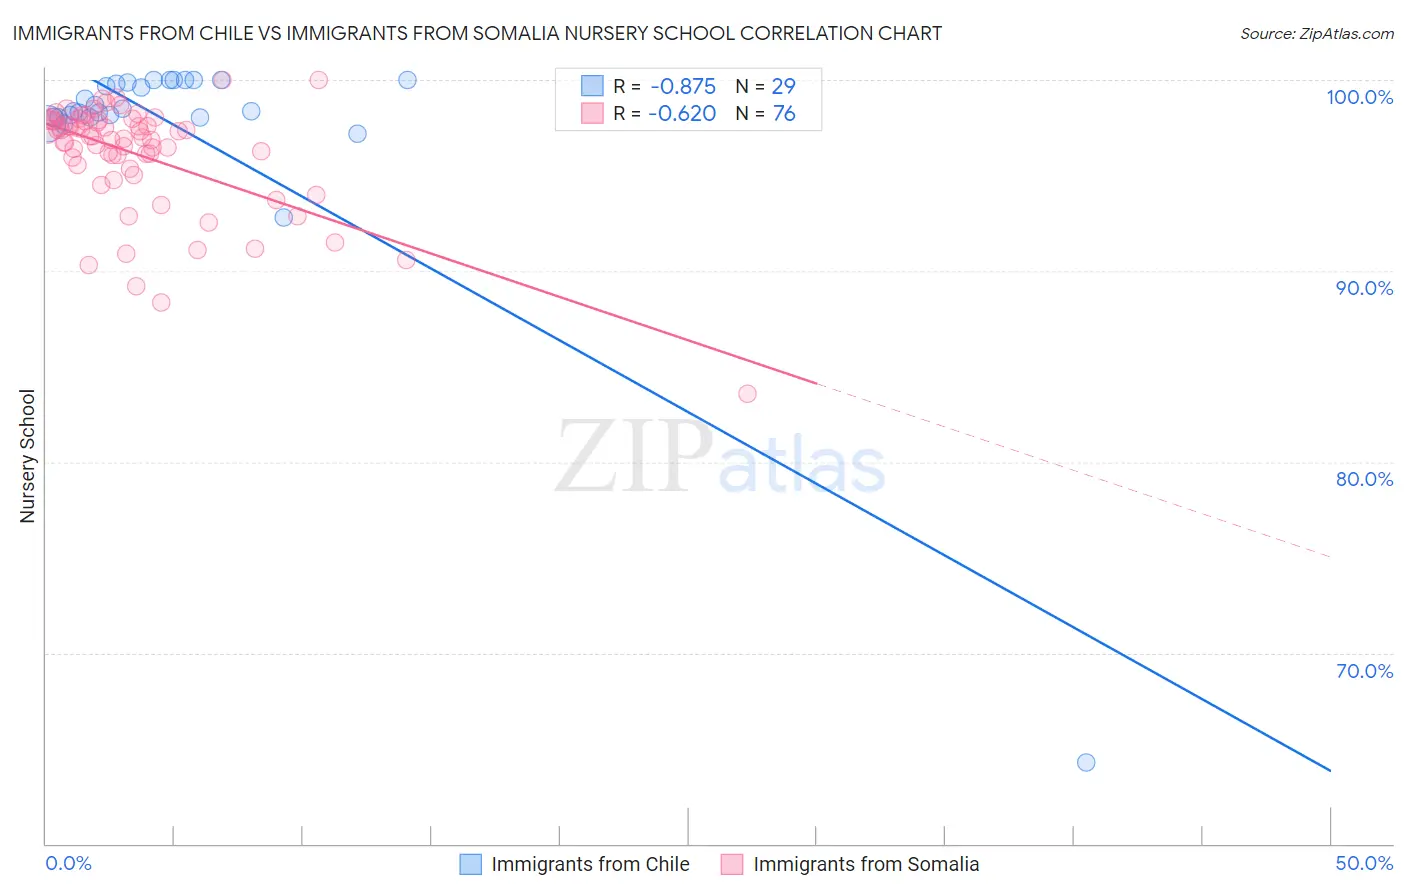
Immigrants from Chile vs Immigrants from Somalia Nursery School Correlation Chart
The statistical analysis conducted on geographies consisting of 218,647,266 people shows a very strong negative correlation between the proportion of Immigrants from Chile and percentage of population with at least nursery school education in the United States with a correlation coefficient (R) of -0.875 and weighted average of 97.9%. Similarly, the statistical analysis conducted on geographies consisting of 92,111,755 people shows a significant negative correlation between the proportion of Immigrants from Somalia and percentage of population with at least nursery school education in the United States with a correlation coefficient (R) of -0.620 and weighted average of 97.0%, a difference of 0.90%.
Nursery School Correlation Summary
| Measurement | Immigrants from Chile | Immigrants from Somalia |
| Minimum | 64.3% | 83.6% |
| Maximum | 100.0% | 100.0% |
| Range | 35.7% | 16.4% |
| Mean | 97.5% | 96.1% |
| Median | 98.4% | 97.0% |
| Interquartile 25% (IQ1) | 98.0% | 95.5% |
| Interquartile 75% (IQ3) | 99.9% | 97.9% |
| Interquartile Range (IQR) | 1.9% | 2.4% |
| Standard Deviation (Sample) | 6.5% | 2.9% |
| Standard Deviation (Population) | 6.4% | 2.9% |
Similar Demographics by Nursery School
Demographics Similar to Immigrants from Chile by Nursery School
In terms of nursery school, the demographic groups most similar to Immigrants from Chile are Immigrants from Uganda (97.9%, a difference of 0.0%), Immigrants from Southern Europe (97.9%, a difference of 0.0%), Immigrants from Albania (97.9%, a difference of 0.0%), Immigrants from Ukraine (97.9%, a difference of 0.010%), and African (97.9%, a difference of 0.010%).
| Demographics | Rating | Rank | Nursery School |
| Immigrants | Kenya | 24.1 /100 | #198 | Fair 97.9% |
| Immigrants | Egypt | 22.5 /100 | #199 | Fair 97.9% |
| Tohono O'odham | 22.2 /100 | #200 | Fair 97.9% |
| Immigrants | Lebanon | 21.2 /100 | #201 | Fair 97.9% |
| Immigrants | Ukraine | 19.9 /100 | #202 | Poor 97.9% |
| Immigrants | Uganda | 18.0 /100 | #203 | Poor 97.9% |
| Immigrants | Southern Europe | 17.4 /100 | #204 | Poor 97.9% |
| Immigrants | Chile | 17.3 /100 | #205 | Poor 97.9% |
| Immigrants | Albania | 16.4 /100 | #206 | Poor 97.9% |
| Africans | 15.4 /100 | #207 | Poor 97.9% |
| Immigrants | Northern Africa | 11.7 /100 | #208 | Poor 97.8% |
| Costa Ricans | 11.3 /100 | #209 | Poor 97.8% |
| Immigrants | Oceania | 10.2 /100 | #210 | Poor 97.8% |
| Laotians | 9.8 /100 | #211 | Tragic 97.8% |
| Immigrants | Bahamas | 8.6 /100 | #212 | Tragic 97.8% |
Demographics Similar to Immigrants from Somalia by Nursery School
In terms of nursery school, the demographic groups most similar to Immigrants from Somalia are Hispanic or Latino (97.0%, a difference of 0.010%), Immigrants from Haiti (97.0%, a difference of 0.010%), Guyanese (97.0%, a difference of 0.010%), Immigrants from the Azores (97.0%, a difference of 0.010%), and Sri Lankan (97.0%, a difference of 0.010%).
| Demographics | Rating | Rank | Nursery School |
| Immigrants | Caribbean | 0.0 /100 | #302 | Tragic 97.1% |
| Nicaraguans | 0.0 /100 | #303 | Tragic 97.1% |
| Ecuadorians | 0.0 /100 | #304 | Tragic 97.1% |
| Somalis | 0.0 /100 | #305 | Tragic 97.1% |
| Belizeans | 0.0 /100 | #306 | Tragic 97.0% |
| Hispanics or Latinos | 0.0 /100 | #307 | Tragic 97.0% |
| Immigrants | Haiti | 0.0 /100 | #308 | Tragic 97.0% |
| Immigrants | Somalia | 0.0 /100 | #309 | Tragic 97.0% |
| Guyanese | 0.0 /100 | #310 | Tragic 97.0% |
| Immigrants | Azores | 0.0 /100 | #311 | Tragic 97.0% |
| Sri Lankans | 0.0 /100 | #312 | Tragic 97.0% |
| Hondurans | 0.0 /100 | #313 | Tragic 97.0% |
| Cape Verdeans | 0.0 /100 | #314 | Tragic 97.0% |
| Immigrants | Nicaragua | 0.0 /100 | #315 | Tragic 96.9% |
| Immigrants | Belize | 0.0 /100 | #316 | Tragic 96.9% |