Immigrants from Chile vs Czechoslovakian In Labor Force | Age > 16
COMPARE
Immigrants from Chile
Czechoslovakian
In Labor Force | Age > 16
In Labor Force | Age > 16 Comparison
Immigrants from Chile
Czechoslovakians
65.9%
IN LABOR FORCE | AGE > 16
98.7/ 100
METRIC RATING
98th/ 347
METRIC RANK
64.3%
IN LABOR FORCE | AGE > 16
1.4/ 100
METRIC RATING
253rd/ 347
METRIC RANK
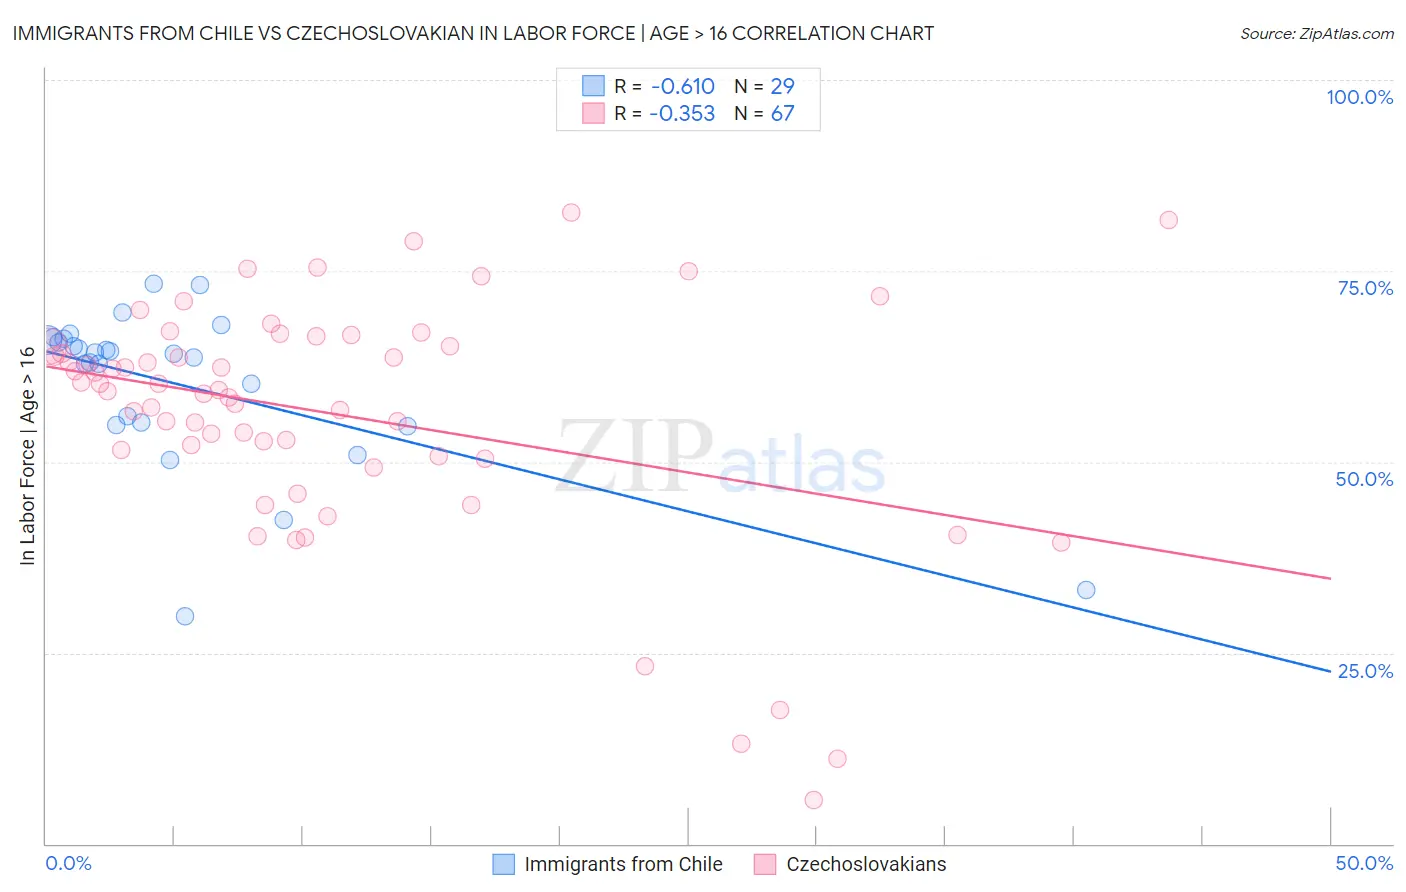
Immigrants from Chile vs Czechoslovakian In Labor Force | Age > 16 Correlation Chart
The statistical analysis conducted on geographies consisting of 218,647,266 people shows a significant negative correlation between the proportion of Immigrants from Chile and labor force participation rate among population ages 16 and over in the United States with a correlation coefficient (R) of -0.610 and weighted average of 65.9%. Similarly, the statistical analysis conducted on geographies consisting of 368,673,303 people shows a mild negative correlation between the proportion of Czechoslovakians and labor force participation rate among population ages 16 and over in the United States with a correlation coefficient (R) of -0.353 and weighted average of 64.3%, a difference of 2.4%.
In Labor Force | Age > 16 Correlation Summary
| Measurement | Immigrants from Chile | Czechoslovakian |
| Minimum | 29.8% | 5.7% |
| Maximum | 73.3% | 82.7% |
| Range | 43.5% | 77.0% |
| Mean | 60.1% | 56.3% |
| Median | 64.2% | 59.4% |
| Interquartile 25% (IQ1) | 55.0% | 50.8% |
| Interquartile 75% (IQ3) | 66.1% | 65.2% |
| Interquartile Range (IQR) | 11.1% | 14.4% |
| Standard Deviation (Sample) | 10.5% | 15.8% |
| Standard Deviation (Population) | 10.3% | 15.7% |
Similar Demographics by In Labor Force | Age > 16
Demographics Similar to Immigrants from Chile by In Labor Force | Age > 16
In terms of in labor force | age > 16, the demographic groups most similar to Immigrants from Chile are Immigrants from Australia (65.9%, a difference of 0.010%), Okinawan (65.9%, a difference of 0.020%), Immigrants from Colombia (65.9%, a difference of 0.020%), Uruguayan (65.9%, a difference of 0.020%), and Filipino (65.9%, a difference of 0.030%).
| Demographics | Rating | Rank | In Labor Force | Age > 16 |
| Iranians | 99.2 /100 | #91 | Exceptional 66.0% |
| Aleuts | 99.1 /100 | #92 | Exceptional 66.0% |
| Immigrants | South America | 99.1 /100 | #93 | Exceptional 66.0% |
| Immigrants | Cambodia | 99.1 /100 | #94 | Exceptional 66.0% |
| Immigrants | Uruguay | 99.1 /100 | #95 | Exceptional 66.0% |
| Bangladeshis | 98.9 /100 | #96 | Exceptional 65.9% |
| Filipinos | 98.9 /100 | #97 | Exceptional 65.9% |
| Immigrants | Chile | 98.7 /100 | #98 | Exceptional 65.9% |
| Immigrants | Australia | 98.7 /100 | #99 | Exceptional 65.9% |
| Okinawans | 98.7 /100 | #100 | Exceptional 65.9% |
| Immigrants | Colombia | 98.6 /100 | #101 | Exceptional 65.9% |
| Uruguayans | 98.6 /100 | #102 | Exceptional 65.9% |
| Immigrants | South Eastern Asia | 98.5 /100 | #103 | Exceptional 65.9% |
| Palestinians | 98.5 /100 | #104 | Exceptional 65.9% |
| Colombians | 98.4 /100 | #105 | Exceptional 65.9% |
Demographics Similar to Czechoslovakians by In Labor Force | Age > 16
In terms of in labor force | age > 16, the demographic groups most similar to Czechoslovakians are Immigrants from Uzbekistan (64.3%, a difference of 0.0%), Immigrants from Dominican Republic (64.4%, a difference of 0.010%), Portuguese (64.4%, a difference of 0.040%), British West Indian (64.4%, a difference of 0.060%), and German (64.4%, a difference of 0.070%).
| Demographics | Rating | Rank | In Labor Force | Age > 16 |
| Immigrants | Caribbean | 2.3 /100 | #246 | Tragic 64.4% |
| Swiss | 2.1 /100 | #247 | Tragic 64.4% |
| Immigrants | Barbados | 2.1 /100 | #248 | Tragic 64.4% |
| Germans | 1.8 /100 | #249 | Tragic 64.4% |
| British West Indians | 1.8 /100 | #250 | Tragic 64.4% |
| Portuguese | 1.6 /100 | #251 | Tragic 64.4% |
| Immigrants | Dominican Republic | 1.5 /100 | #252 | Tragic 64.4% |
| Czechoslovakians | 1.4 /100 | #253 | Tragic 64.3% |
| Immigrants | Uzbekistan | 1.4 /100 | #254 | Tragic 64.3% |
| Hispanics or Latinos | 1.1 /100 | #255 | Tragic 64.3% |
| Immigrants | Mexico | 1.0 /100 | #256 | Tragic 64.3% |
| Inupiat | 0.8 /100 | #257 | Tragic 64.3% |
| Immigrants | Scotland | 0.8 /100 | #258 | Tragic 64.2% |
| Immigrants | Western Europe | 0.7 /100 | #259 | Tragic 64.2% |
| Marshallese | 0.7 /100 | #260 | Tragic 64.2% |