Dutch West Indian vs Immigrants from Somalia In Labor Force | Age > 16
COMPARE
Dutch West Indian
Immigrants from Somalia
In Labor Force | Age > 16
In Labor Force | Age > 16 Comparison
Dutch West Indians
Immigrants from Somalia
61.7%
IN LABOR FORCE | AGE > 16
0.0/ 100
METRIC RATING
328th/ 347
METRIC RANK
69.1%
IN LABOR FORCE | AGE > 16
100.0/ 100
METRIC RATING
4th/ 347
METRIC RANK
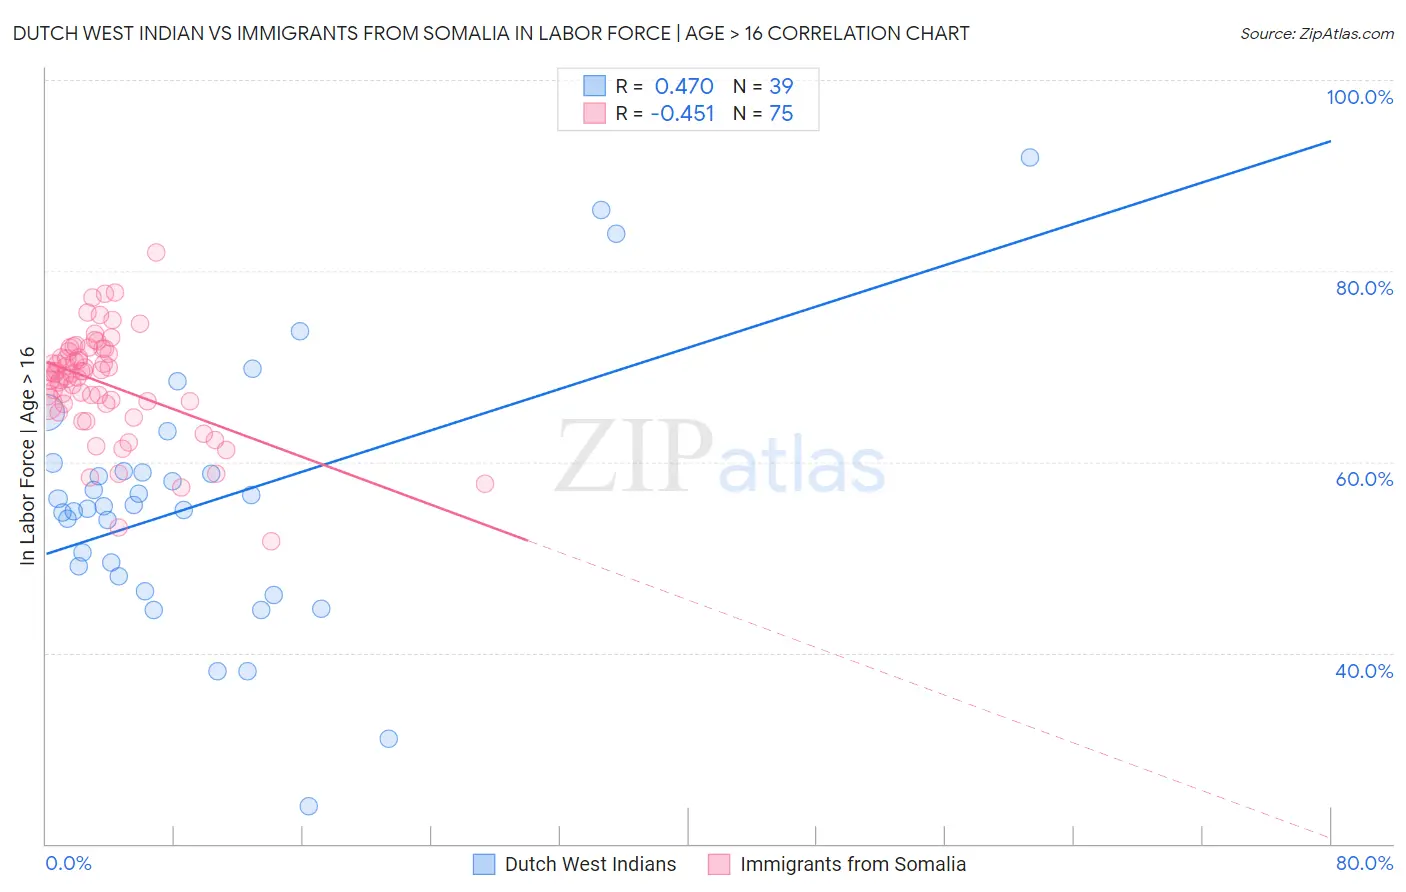
Dutch West Indian vs Immigrants from Somalia In Labor Force | Age > 16 Correlation Chart
The statistical analysis conducted on geographies consisting of 85,770,506 people shows a moderate positive correlation between the proportion of Dutch West Indians and labor force participation rate among population ages 16 and over in the United States with a correlation coefficient (R) of 0.470 and weighted average of 61.7%. Similarly, the statistical analysis conducted on geographies consisting of 92,107,842 people shows a moderate negative correlation between the proportion of Immigrants from Somalia and labor force participation rate among population ages 16 and over in the United States with a correlation coefficient (R) of -0.451 and weighted average of 69.1%, a difference of 12.0%.
In Labor Force | Age > 16 Correlation Summary
| Measurement | Dutch West Indian | Immigrants from Somalia |
| Minimum | 23.9% | 51.7% |
| Maximum | 91.9% | 81.9% |
| Range | 68.0% | 30.2% |
| Mean | 55.8% | 68.2% |
| Median | 55.4% | 69.2% |
| Interquartile 25% (IQ1) | 48.0% | 66.1% |
| Interquartile 75% (IQ3) | 59.0% | 71.6% |
| Interquartile Range (IQR) | 11.1% | 5.5% |
| Standard Deviation (Sample) | 13.5% | 5.5% |
| Standard Deviation (Population) | 13.3% | 5.5% |
Similar Demographics by In Labor Force | Age > 16
Demographics Similar to Dutch West Indians by In Labor Force | Age > 16
In terms of in labor force | age > 16, the demographic groups most similar to Dutch West Indians are Cajun (61.8%, a difference of 0.16%), Sioux (61.8%, a difference of 0.27%), Choctaw (61.5%, a difference of 0.36%), Cherokee (61.9%, a difference of 0.45%), and Cheyenne (62.0%, a difference of 0.49%).
| Demographics | Rating | Rank | In Labor Force | Age > 16 |
| Americans | 0.0 /100 | #321 | Tragic 62.1% |
| Ottawa | 0.0 /100 | #322 | Tragic 62.0% |
| Seminole | 0.0 /100 | #323 | Tragic 62.0% |
| Cheyenne | 0.0 /100 | #324 | Tragic 62.0% |
| Cherokee | 0.0 /100 | #325 | Tragic 61.9% |
| Sioux | 0.0 /100 | #326 | Tragic 61.8% |
| Cajuns | 0.0 /100 | #327 | Tragic 61.8% |
| Dutch West Indians | 0.0 /100 | #328 | Tragic 61.7% |
| Choctaw | 0.0 /100 | #329 | Tragic 61.5% |
| Creek | 0.0 /100 | #330 | Tragic 61.3% |
| Ute | 0.0 /100 | #331 | Tragic 60.9% |
| Crow | 0.0 /100 | #332 | Tragic 60.8% |
| Paiute | 0.0 /100 | #333 | Tragic 60.7% |
| Apache | 0.0 /100 | #334 | Tragic 60.7% |
| Natives/Alaskans | 0.0 /100 | #335 | Tragic 60.6% |
Demographics Similar to Immigrants from Somalia by In Labor Force | Age > 16
In terms of in labor force | age > 16, the demographic groups most similar to Immigrants from Somalia are Somali (69.2%, a difference of 0.070%), Ethiopian (69.3%, a difference of 0.27%), Sierra Leonean (68.9%, a difference of 0.31%), Immigrants from Eritrea (68.9%, a difference of 0.36%), and Immigrants from Ethiopia (69.4%, a difference of 0.44%).
| Demographics | Rating | Rank | In Labor Force | Age > 16 |
| Immigrants | Ethiopia | 100.0 /100 | #1 | Exceptional 69.4% |
| Ethiopians | 100.0 /100 | #2 | Exceptional 69.3% |
| Somalis | 100.0 /100 | #3 | Exceptional 69.2% |
| Immigrants | Somalia | 100.0 /100 | #4 | Exceptional 69.1% |
| Sierra Leoneans | 100.0 /100 | #5 | Exceptional 68.9% |
| Immigrants | Eritrea | 100.0 /100 | #6 | Exceptional 68.9% |
| Immigrants | Cameroon | 100.0 /100 | #7 | Exceptional 68.7% |
| Immigrants | Sierra Leone | 100.0 /100 | #8 | Exceptional 68.5% |
| Immigrants | Eastern Africa | 100.0 /100 | #9 | Exceptional 68.5% |
| Immigrants | Bolivia | 100.0 /100 | #10 | Exceptional 68.4% |
| Bolivians | 100.0 /100 | #11 | Exceptional 68.2% |
| Sudanese | 100.0 /100 | #12 | Exceptional 68.0% |
| Immigrants | Nepal | 100.0 /100 | #13 | Exceptional 68.0% |
| Liberians | 100.0 /100 | #14 | Exceptional 67.8% |
| Immigrants | Middle Africa | 100.0 /100 | #15 | Exceptional 67.7% |