Immigrants from Chile vs Immigrants from Asia In Labor Force | Age > 16
COMPARE
Immigrants from Chile
Immigrants from Asia
In Labor Force | Age > 16
In Labor Force | Age > 16 Comparison
Immigrants from Chile
Immigrants from Asia
65.9%
IN LABOR FORCE | AGE > 16
98.7/ 100
METRIC RATING
98th/ 347
METRIC RANK
66.1%
IN LABOR FORCE | AGE > 16
99.6/ 100
METRIC RATING
78th/ 347
METRIC RANK
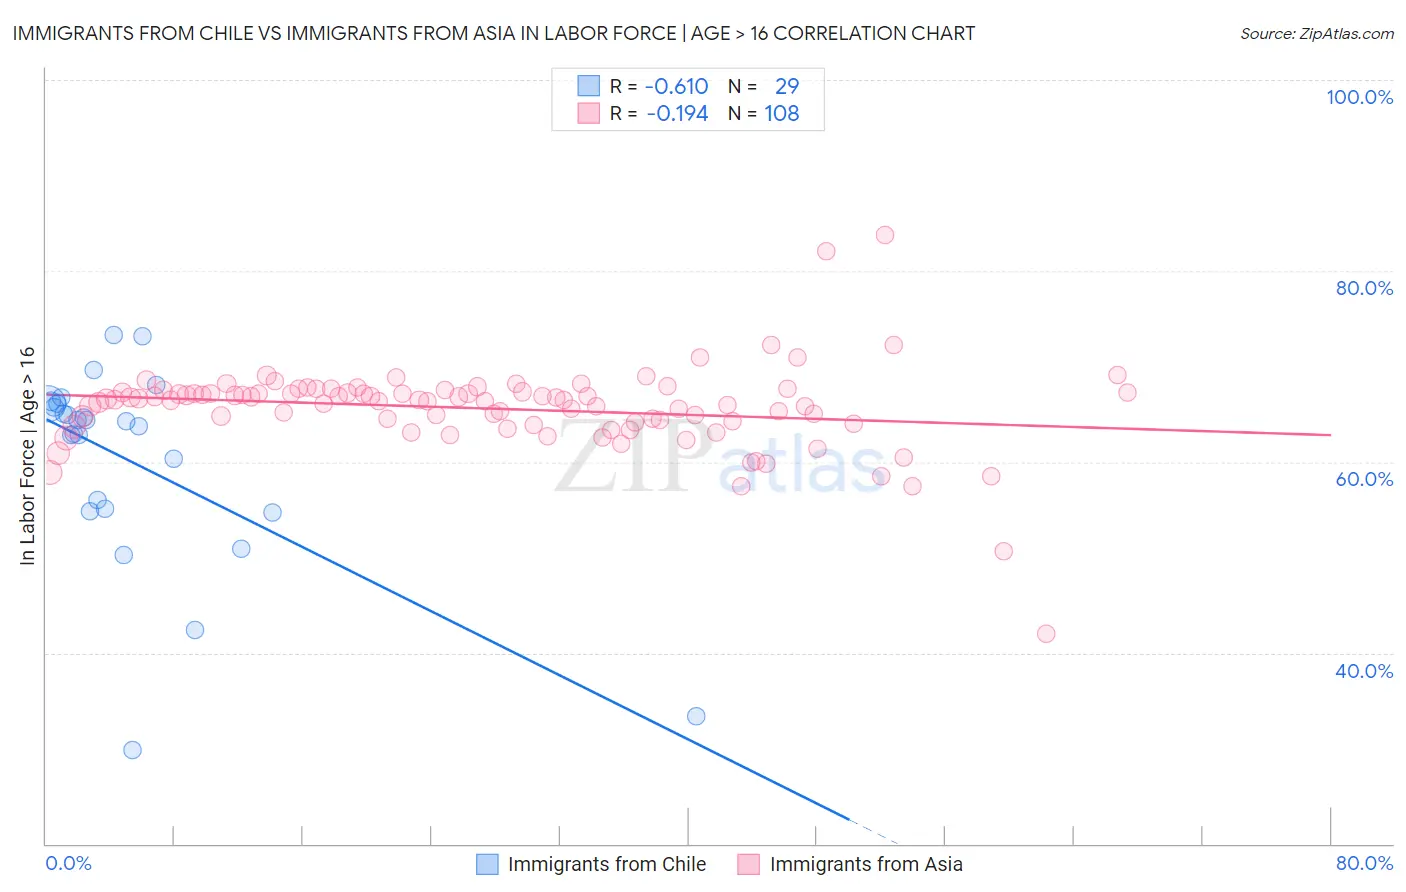
Immigrants from Chile vs Immigrants from Asia In Labor Force | Age > 16 Correlation Chart
The statistical analysis conducted on geographies consisting of 218,647,266 people shows a significant negative correlation between the proportion of Immigrants from Chile and labor force participation rate among population ages 16 and over in the United States with a correlation coefficient (R) of -0.610 and weighted average of 65.9%. Similarly, the statistical analysis conducted on geographies consisting of 549,187,729 people shows a poor negative correlation between the proportion of Immigrants from Asia and labor force participation rate among population ages 16 and over in the United States with a correlation coefficient (R) of -0.194 and weighted average of 66.1%, a difference of 0.34%.
In Labor Force | Age > 16 Correlation Summary
| Measurement | Immigrants from Chile | Immigrants from Asia |
| Minimum | 29.8% | 42.0% |
| Maximum | 73.3% | 83.8% |
| Range | 43.5% | 41.8% |
| Mean | 60.1% | 65.6% |
| Median | 64.2% | 66.5% |
| Interquartile 25% (IQ1) | 55.0% | 64.0% |
| Interquartile 75% (IQ3) | 66.1% | 67.3% |
| Interquartile Range (IQR) | 11.1% | 3.3% |
| Standard Deviation (Sample) | 10.5% | 4.6% |
| Standard Deviation (Population) | 10.3% | 4.6% |
Demographics Similar to Immigrants from Chile and Immigrants from Asia by In Labor Force | Age > 16
In terms of in labor force | age > 16, the demographic groups most similar to Immigrants from Chile are Filipino (65.9%, a difference of 0.030%), Bangladeshi (65.9%, a difference of 0.040%), Immigrants from Cambodia (66.0%, a difference of 0.090%), Immigrants from Uruguay (66.0%, a difference of 0.090%), and Aleut (66.0%, a difference of 0.11%). Similarly, the demographic groups most similar to Immigrants from Asia are Turkish (66.1%, a difference of 0.030%), Malaysian (66.1%, a difference of 0.040%), Moroccan (66.1%, a difference of 0.090%), German Russian (66.1%, a difference of 0.10%), and Immigrants from Jordan (66.1%, a difference of 0.10%).
| Demographics | Rating | Rank | In Labor Force | Age > 16 |
| Immigrants | Asia | 99.6 /100 | #78 | Exceptional 66.1% |
| Turks | 99.6 /100 | #79 | Exceptional 66.1% |
| Malaysians | 99.6 /100 | #80 | Exceptional 66.1% |
| Moroccans | 99.5 /100 | #81 | Exceptional 66.1% |
| German Russians | 99.4 /100 | #82 | Exceptional 66.1% |
| Immigrants | Jordan | 99.4 /100 | #83 | Exceptional 66.1% |
| Central Americans | 99.4 /100 | #84 | Exceptional 66.1% |
| Mongolians | 99.4 /100 | #85 | Exceptional 66.1% |
| South Americans | 99.4 /100 | #86 | Exceptional 66.0% |
| South American Indians | 99.4 /100 | #87 | Exceptional 66.0% |
| Bermudans | 99.3 /100 | #88 | Exceptional 66.0% |
| Immigrants | Laos | 99.2 /100 | #89 | Exceptional 66.0% |
| Chileans | 99.2 /100 | #90 | Exceptional 66.0% |
| Iranians | 99.2 /100 | #91 | Exceptional 66.0% |
| Aleuts | 99.1 /100 | #92 | Exceptional 66.0% |
| Immigrants | South America | 99.1 /100 | #93 | Exceptional 66.0% |
| Immigrants | Cambodia | 99.1 /100 | #94 | Exceptional 66.0% |
| Immigrants | Uruguay | 99.1 /100 | #95 | Exceptional 66.0% |
| Bangladeshis | 98.9 /100 | #96 | Exceptional 65.9% |
| Filipinos | 98.9 /100 | #97 | Exceptional 65.9% |
| Immigrants | Chile | 98.7 /100 | #98 | Exceptional 65.9% |