Colville vs Immigrants from Asia In Labor Force | Age > 16
COMPARE
Colville
Immigrants from Asia
In Labor Force | Age > 16
In Labor Force | Age > 16 Comparison
Colville
Immigrants from Asia
59.8%
IN LABOR FORCE | AGE > 16
0.0/ 100
METRIC RATING
337th/ 347
METRIC RANK
66.1%
IN LABOR FORCE | AGE > 16
99.6/ 100
METRIC RATING
78th/ 347
METRIC RANK
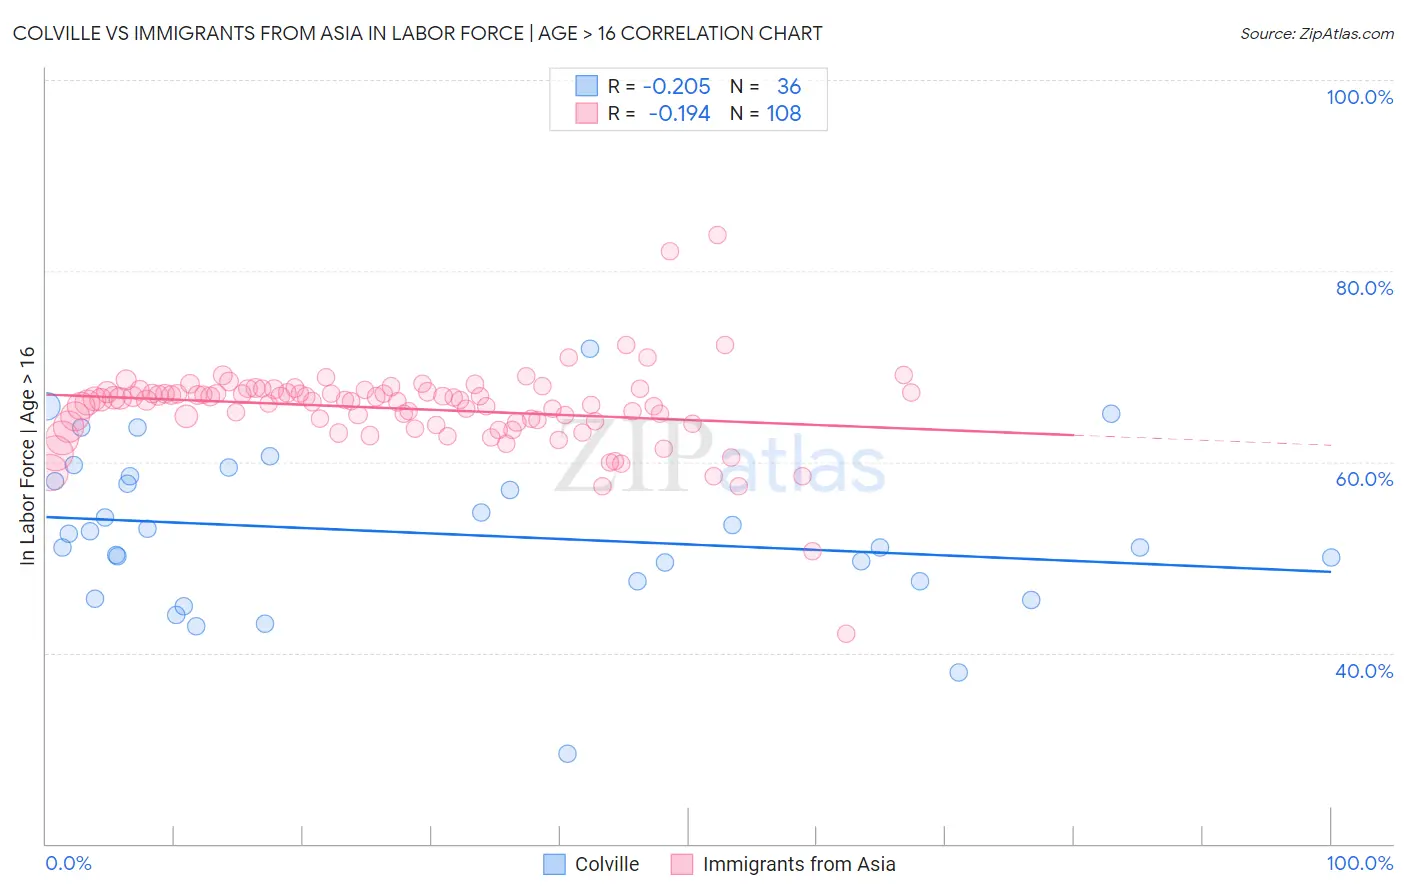
Colville vs Immigrants from Asia In Labor Force | Age > 16 Correlation Chart
The statistical analysis conducted on geographies consisting of 34,687,961 people shows a weak negative correlation between the proportion of Colville and labor force participation rate among population ages 16 and over in the United States with a correlation coefficient (R) of -0.205 and weighted average of 59.8%. Similarly, the statistical analysis conducted on geographies consisting of 549,187,729 people shows a poor negative correlation between the proportion of Immigrants from Asia and labor force participation rate among population ages 16 and over in the United States with a correlation coefficient (R) of -0.194 and weighted average of 66.1%, a difference of 10.6%.
In Labor Force | Age > 16 Correlation Summary
| Measurement | Colville | Immigrants from Asia |
| Minimum | 29.4% | 42.0% |
| Maximum | 71.9% | 83.8% |
| Range | 42.5% | 41.8% |
| Mean | 52.5% | 65.6% |
| Median | 51.7% | 66.5% |
| Interquartile 25% (IQ1) | 47.5% | 64.0% |
| Interquartile 75% (IQ3) | 58.2% | 67.3% |
| Interquartile Range (IQR) | 10.7% | 3.3% |
| Standard Deviation (Sample) | 8.4% | 4.6% |
| Standard Deviation (Population) | 8.3% | 4.6% |
Similar Demographics by In Labor Force | Age > 16
Demographics Similar to Colville by In Labor Force | Age > 16
In terms of in labor force | age > 16, the demographic groups most similar to Colville are Immigrants from Yemen (59.6%, a difference of 0.27%), Houma (59.5%, a difference of 0.52%), Pueblo (59.3%, a difference of 0.92%), Menominee (60.6%, a difference of 1.3%), and Native/Alaskan (60.6%, a difference of 1.3%).
| Demographics | Rating | Rank | In Labor Force | Age > 16 |
| Creek | 0.0 /100 | #330 | Tragic 61.3% |
| Ute | 0.0 /100 | #331 | Tragic 60.9% |
| Crow | 0.0 /100 | #332 | Tragic 60.8% |
| Paiute | 0.0 /100 | #333 | Tragic 60.7% |
| Apache | 0.0 /100 | #334 | Tragic 60.7% |
| Natives/Alaskans | 0.0 /100 | #335 | Tragic 60.6% |
| Menominee | 0.0 /100 | #336 | Tragic 60.6% |
| Colville | 0.0 /100 | #337 | Tragic 59.8% |
| Immigrants | Yemen | 0.0 /100 | #338 | Tragic 59.6% |
| Houma | 0.0 /100 | #339 | Tragic 59.5% |
| Pueblo | 0.0 /100 | #340 | Tragic 59.3% |
| Hopi | 0.0 /100 | #341 | Tragic 58.4% |
| Puerto Ricans | 0.0 /100 | #342 | Tragic 58.1% |
| Yuman | 0.0 /100 | #343 | Tragic 57.8% |
| Pima | 0.0 /100 | #344 | Tragic 57.4% |
Demographics Similar to Immigrants from Asia by In Labor Force | Age > 16
In terms of in labor force | age > 16, the demographic groups most similar to Immigrants from Asia are Immigrants from Moldova (66.1%, a difference of 0.0%), Immigrants from Malaysia (66.1%, a difference of 0.010%), Turkish (66.1%, a difference of 0.030%), Malaysian (66.1%, a difference of 0.040%), and Immigrants from Singapore (66.2%, a difference of 0.060%).
| Demographics | Rating | Rank | In Labor Force | Age > 16 |
| Burmese | 99.7 /100 | #71 | Exceptional 66.2% |
| Taiwanese | 99.7 /100 | #72 | Exceptional 66.2% |
| Immigrants | Vietnam | 99.7 /100 | #73 | Exceptional 66.2% |
| Immigrants | Korea | 99.7 /100 | #74 | Exceptional 66.2% |
| Immigrants | Singapore | 99.7 /100 | #75 | Exceptional 66.2% |
| Immigrants | Malaysia | 99.6 /100 | #76 | Exceptional 66.1% |
| Immigrants | Moldova | 99.6 /100 | #77 | Exceptional 66.1% |
| Immigrants | Asia | 99.6 /100 | #78 | Exceptional 66.1% |
| Turks | 99.6 /100 | #79 | Exceptional 66.1% |
| Malaysians | 99.6 /100 | #80 | Exceptional 66.1% |
| Moroccans | 99.5 /100 | #81 | Exceptional 66.1% |
| German Russians | 99.4 /100 | #82 | Exceptional 66.1% |
| Immigrants | Jordan | 99.4 /100 | #83 | Exceptional 66.1% |
| Central Americans | 99.4 /100 | #84 | Exceptional 66.1% |
| Mongolians | 99.4 /100 | #85 | Exceptional 66.1% |