Guyanese vs Immigrants from Asia In Labor Force | Age > 16
COMPARE
Guyanese
Immigrants from Asia
In Labor Force | Age > 16
In Labor Force | Age > 16 Comparison
Guyanese
Immigrants from Asia
64.1%
IN LABOR FORCE | AGE > 16
0.4/ 100
METRIC RATING
270th/ 347
METRIC RANK
66.1%
IN LABOR FORCE | AGE > 16
99.6/ 100
METRIC RATING
78th/ 347
METRIC RANK
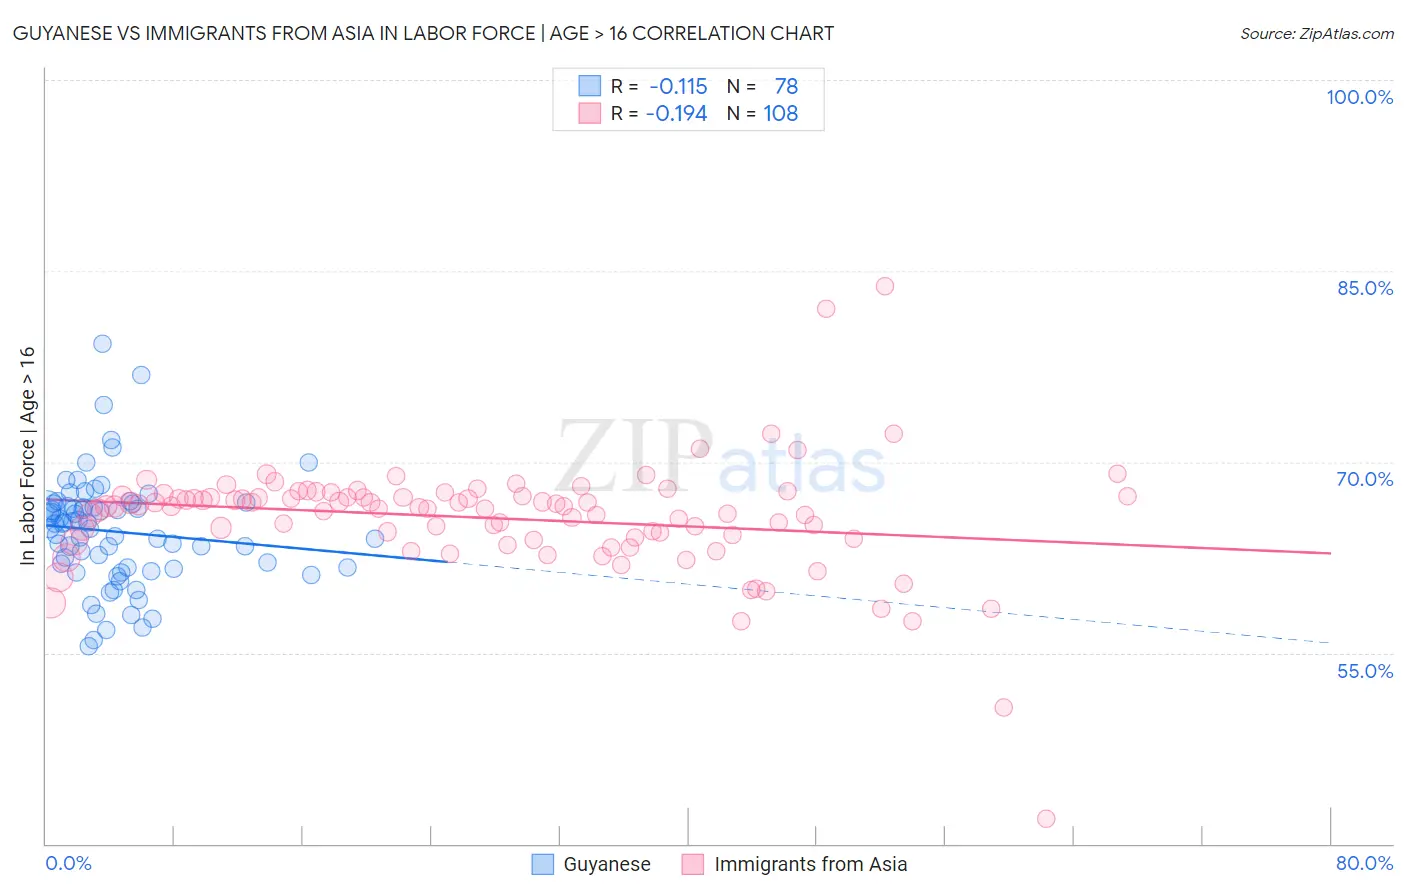
Guyanese vs Immigrants from Asia In Labor Force | Age > 16 Correlation Chart
The statistical analysis conducted on geographies consisting of 176,935,808 people shows a poor negative correlation between the proportion of Guyanese and labor force participation rate among population ages 16 and over in the United States with a correlation coefficient (R) of -0.115 and weighted average of 64.1%. Similarly, the statistical analysis conducted on geographies consisting of 549,187,729 people shows a poor negative correlation between the proportion of Immigrants from Asia and labor force participation rate among population ages 16 and over in the United States with a correlation coefficient (R) of -0.194 and weighted average of 66.1%, a difference of 3.2%.
In Labor Force | Age > 16 Correlation Summary
| Measurement | Guyanese | Immigrants from Asia |
| Minimum | 55.5% | 42.0% |
| Maximum | 79.3% | 83.8% |
| Range | 23.8% | 41.8% |
| Mean | 64.5% | 65.6% |
| Median | 64.9% | 66.5% |
| Interquartile 25% (IQ1) | 61.7% | 64.0% |
| Interquartile 75% (IQ3) | 66.5% | 67.3% |
| Interquartile Range (IQR) | 4.8% | 3.3% |
| Standard Deviation (Sample) | 4.3% | 4.6% |
| Standard Deviation (Population) | 4.3% | 4.6% |
Similar Demographics by In Labor Force | Age > 16
Demographics Similar to Guyanese by In Labor Force | Age > 16
In terms of in labor force | age > 16, the demographic groups most similar to Guyanese are Dominican (64.1%, a difference of 0.0%), Irish (64.1%, a difference of 0.030%), Native Hawaiian (64.1%, a difference of 0.030%), Hmong (64.1%, a difference of 0.030%), and Immigrants from Cuba (64.1%, a difference of 0.050%).
| Demographics | Rating | Rank | In Labor Force | Age > 16 |
| Bahamians | 0.6 /100 | #263 | Tragic 64.2% |
| Dutch | 0.6 /100 | #264 | Tragic 64.2% |
| Cubans | 0.5 /100 | #265 | Tragic 64.2% |
| Immigrants | England | 0.5 /100 | #266 | Tragic 64.2% |
| Canadians | 0.5 /100 | #267 | Tragic 64.1% |
| Spaniards | 0.5 /100 | #268 | Tragic 64.1% |
| Irish | 0.4 /100 | #269 | Tragic 64.1% |
| Guyanese | 0.4 /100 | #270 | Tragic 64.1% |
| Dominicans | 0.4 /100 | #271 | Tragic 64.1% |
| Native Hawaiians | 0.3 /100 | #272 | Tragic 64.1% |
| Hmong | 0.3 /100 | #273 | Tragic 64.1% |
| Immigrants | Cuba | 0.3 /100 | #274 | Tragic 64.1% |
| Mexicans | 0.3 /100 | #275 | Tragic 64.1% |
| French American Indians | 0.3 /100 | #276 | Tragic 64.1% |
| Immigrants | Bahamas | 0.3 /100 | #277 | Tragic 64.0% |
Demographics Similar to Immigrants from Asia by In Labor Force | Age > 16
In terms of in labor force | age > 16, the demographic groups most similar to Immigrants from Asia are Immigrants from Moldova (66.1%, a difference of 0.0%), Immigrants from Malaysia (66.1%, a difference of 0.010%), Turkish (66.1%, a difference of 0.030%), Malaysian (66.1%, a difference of 0.040%), and Immigrants from Singapore (66.2%, a difference of 0.060%).
| Demographics | Rating | Rank | In Labor Force | Age > 16 |
| Burmese | 99.7 /100 | #71 | Exceptional 66.2% |
| Taiwanese | 99.7 /100 | #72 | Exceptional 66.2% |
| Immigrants | Vietnam | 99.7 /100 | #73 | Exceptional 66.2% |
| Immigrants | Korea | 99.7 /100 | #74 | Exceptional 66.2% |
| Immigrants | Singapore | 99.7 /100 | #75 | Exceptional 66.2% |
| Immigrants | Malaysia | 99.6 /100 | #76 | Exceptional 66.1% |
| Immigrants | Moldova | 99.6 /100 | #77 | Exceptional 66.1% |
| Immigrants | Asia | 99.6 /100 | #78 | Exceptional 66.1% |
| Turks | 99.6 /100 | #79 | Exceptional 66.1% |
| Malaysians | 99.6 /100 | #80 | Exceptional 66.1% |
| Moroccans | 99.5 /100 | #81 | Exceptional 66.1% |
| German Russians | 99.4 /100 | #82 | Exceptional 66.1% |
| Immigrants | Jordan | 99.4 /100 | #83 | Exceptional 66.1% |
| Central Americans | 99.4 /100 | #84 | Exceptional 66.1% |
| Mongolians | 99.4 /100 | #85 | Exceptional 66.1% |