Ugandan vs Immigrants from Asia In Labor Force | Age > 16
COMPARE
Ugandan
Immigrants from Asia
In Labor Force | Age > 16
In Labor Force | Age > 16 Comparison
Ugandans
Immigrants from Asia
67.4%
IN LABOR FORCE | AGE > 16
100.0/ 100
METRIC RATING
24th/ 347
METRIC RANK
66.1%
IN LABOR FORCE | AGE > 16
99.6/ 100
METRIC RATING
78th/ 347
METRIC RANK
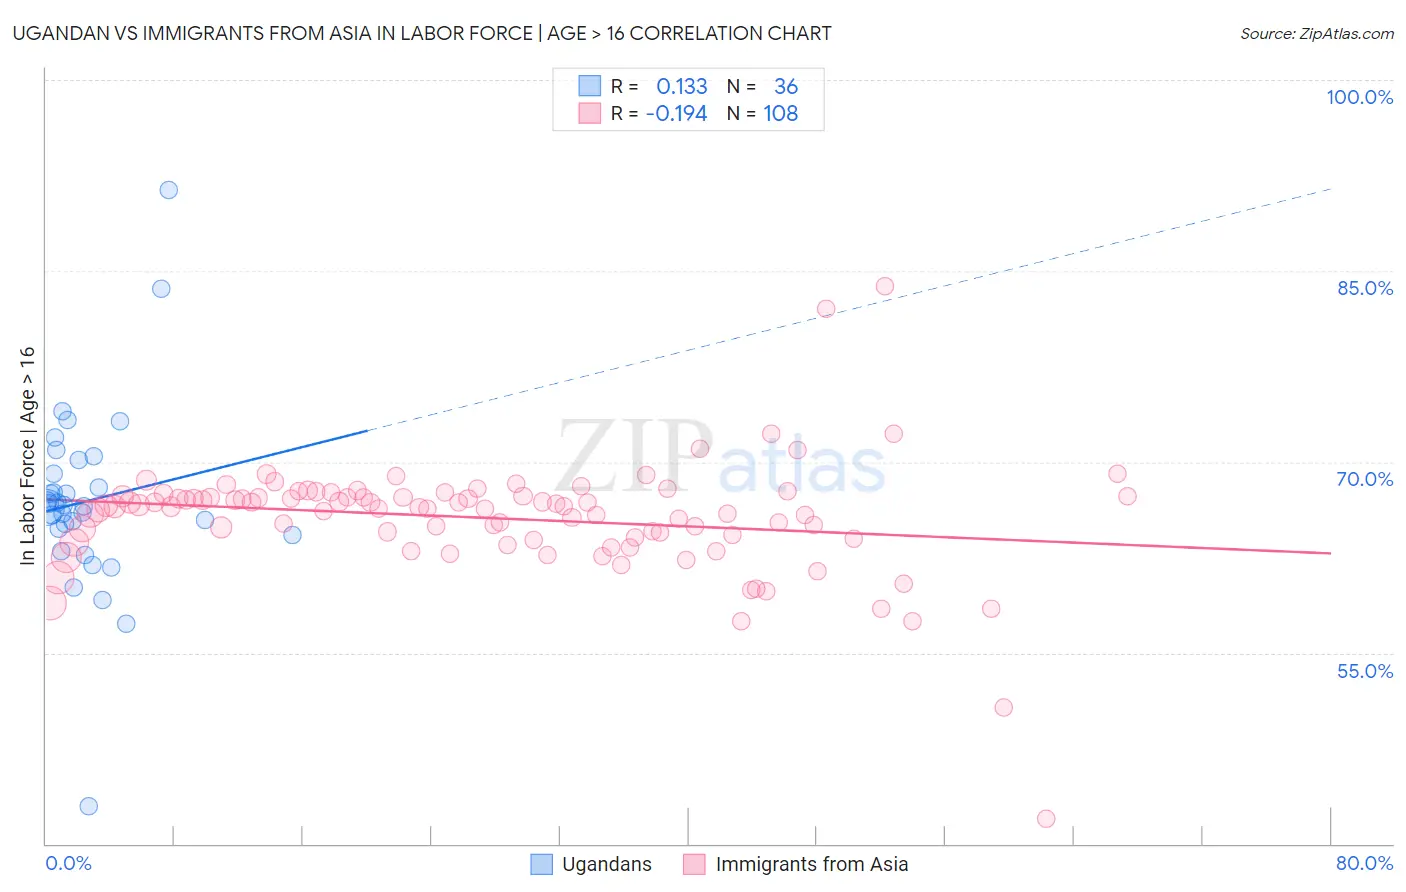
Ugandan vs Immigrants from Asia In Labor Force | Age > 16 Correlation Chart
The statistical analysis conducted on geographies consisting of 94,018,069 people shows a poor positive correlation between the proportion of Ugandans and labor force participation rate among population ages 16 and over in the United States with a correlation coefficient (R) of 0.133 and weighted average of 67.4%. Similarly, the statistical analysis conducted on geographies consisting of 549,187,729 people shows a poor negative correlation between the proportion of Immigrants from Asia and labor force participation rate among population ages 16 and over in the United States with a correlation coefficient (R) of -0.194 and weighted average of 66.1%, a difference of 1.9%.
In Labor Force | Age > 16 Correlation Summary
| Measurement | Ugandan | Immigrants from Asia |
| Minimum | 42.9% | 42.0% |
| Maximum | 91.4% | 83.8% |
| Range | 48.5% | 41.8% |
| Mean | 66.9% | 65.6% |
| Median | 66.5% | 66.5% |
| Interquartile 25% (IQ1) | 64.5% | 64.0% |
| Interquartile 75% (IQ3) | 69.6% | 67.3% |
| Interquartile Range (IQR) | 5.1% | 3.3% |
| Standard Deviation (Sample) | 7.5% | 4.6% |
| Standard Deviation (Population) | 7.4% | 4.6% |
Similar Demographics by In Labor Force | Age > 16
Demographics Similar to Ugandans by In Labor Force | Age > 16
In terms of in labor force | age > 16, the demographic groups most similar to Ugandans are Immigrants from Africa (67.4%, a difference of 0.030%), Immigrants from Cabo Verde (67.3%, a difference of 0.050%), Cambodian (67.4%, a difference of 0.060%), Zimbabwean (67.3%, a difference of 0.13%), and Immigrants from Uganda (67.5%, a difference of 0.18%).
| Demographics | Rating | Rank | In Labor Force | Age > 16 |
| Immigrants | India | 100.0 /100 | #17 | Exceptional 67.6% |
| Immigrants | Liberia | 100.0 /100 | #18 | Exceptional 67.6% |
| Kenyans | 100.0 /100 | #19 | Exceptional 67.6% |
| Immigrants | Kenya | 100.0 /100 | #20 | Exceptional 67.6% |
| Tongans | 100.0 /100 | #21 | Exceptional 67.5% |
| Immigrants | Uganda | 100.0 /100 | #22 | Exceptional 67.5% |
| Cambodians | 100.0 /100 | #23 | Exceptional 67.4% |
| Ugandans | 100.0 /100 | #24 | Exceptional 67.4% |
| Immigrants | Africa | 100.0 /100 | #25 | Exceptional 67.4% |
| Immigrants | Cabo Verde | 100.0 /100 | #26 | Exceptional 67.3% |
| Zimbabweans | 100.0 /100 | #27 | Exceptional 67.3% |
| Immigrants | Morocco | 100.0 /100 | #28 | Exceptional 67.2% |
| Thais | 100.0 /100 | #29 | Exceptional 67.2% |
| Immigrants | Zaire | 100.0 /100 | #30 | Exceptional 67.2% |
| Ghanaians | 100.0 /100 | #31 | Exceptional 67.1% |
Demographics Similar to Immigrants from Asia by In Labor Force | Age > 16
In terms of in labor force | age > 16, the demographic groups most similar to Immigrants from Asia are Immigrants from Moldova (66.1%, a difference of 0.0%), Immigrants from Malaysia (66.1%, a difference of 0.010%), Turkish (66.1%, a difference of 0.030%), Malaysian (66.1%, a difference of 0.040%), and Immigrants from Singapore (66.2%, a difference of 0.060%).
| Demographics | Rating | Rank | In Labor Force | Age > 16 |
| Burmese | 99.7 /100 | #71 | Exceptional 66.2% |
| Taiwanese | 99.7 /100 | #72 | Exceptional 66.2% |
| Immigrants | Vietnam | 99.7 /100 | #73 | Exceptional 66.2% |
| Immigrants | Korea | 99.7 /100 | #74 | Exceptional 66.2% |
| Immigrants | Singapore | 99.7 /100 | #75 | Exceptional 66.2% |
| Immigrants | Malaysia | 99.6 /100 | #76 | Exceptional 66.1% |
| Immigrants | Moldova | 99.6 /100 | #77 | Exceptional 66.1% |
| Immigrants | Asia | 99.6 /100 | #78 | Exceptional 66.1% |
| Turks | 99.6 /100 | #79 | Exceptional 66.1% |
| Malaysians | 99.6 /100 | #80 | Exceptional 66.1% |
| Moroccans | 99.5 /100 | #81 | Exceptional 66.1% |
| German Russians | 99.4 /100 | #82 | Exceptional 66.1% |
| Immigrants | Jordan | 99.4 /100 | #83 | Exceptional 66.1% |
| Central Americans | 99.4 /100 | #84 | Exceptional 66.1% |
| Mongolians | 99.4 /100 | #85 | Exceptional 66.1% |