Central American Indian vs Czechoslovakian In Labor Force | Age > 16
COMPARE
Central American Indian
Czechoslovakian
In Labor Force | Age > 16
In Labor Force | Age > 16 Comparison
Central American Indians
Czechoslovakians
63.4%
IN LABOR FORCE | AGE > 16
0.0/ 100
METRIC RATING
307th/ 347
METRIC RANK
64.3%
IN LABOR FORCE | AGE > 16
1.4/ 100
METRIC RATING
253rd/ 347
METRIC RANK
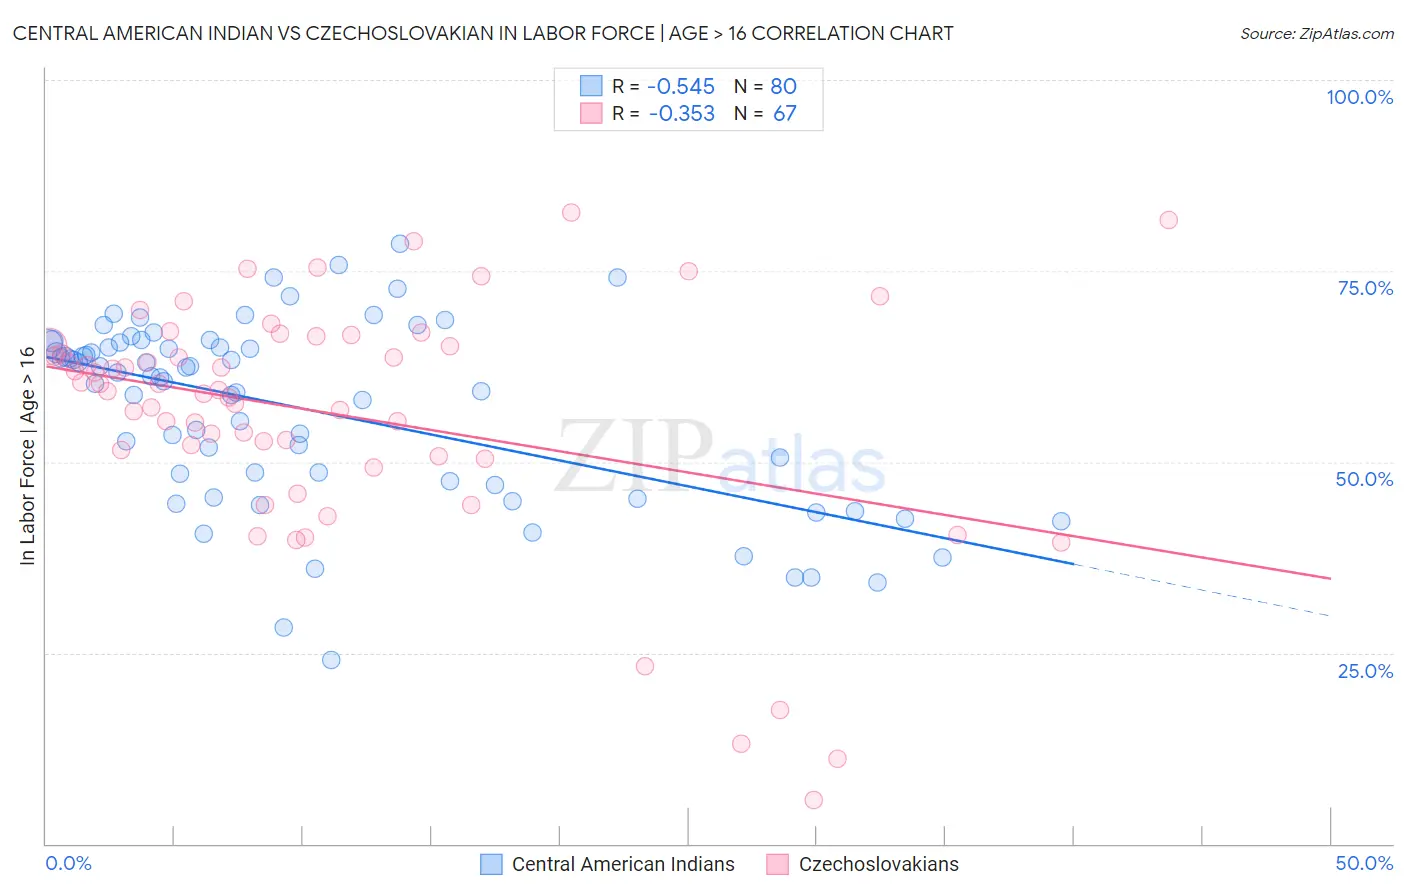
Central American Indian vs Czechoslovakian In Labor Force | Age > 16 Correlation Chart
The statistical analysis conducted on geographies consisting of 326,143,757 people shows a substantial negative correlation between the proportion of Central American Indians and labor force participation rate among population ages 16 and over in the United States with a correlation coefficient (R) of -0.545 and weighted average of 63.4%. Similarly, the statistical analysis conducted on geographies consisting of 368,673,303 people shows a mild negative correlation between the proportion of Czechoslovakians and labor force participation rate among population ages 16 and over in the United States with a correlation coefficient (R) of -0.353 and weighted average of 64.3%, a difference of 1.5%.
In Labor Force | Age > 16 Correlation Summary
| Measurement | Central American Indian | Czechoslovakian |
| Minimum | 24.0% | 5.7% |
| Maximum | 78.6% | 82.7% |
| Range | 54.6% | 77.0% |
| Mean | 56.8% | 56.3% |
| Median | 61.1% | 59.4% |
| Interquartile 25% (IQ1) | 47.2% | 50.8% |
| Interquartile 75% (IQ3) | 65.2% | 65.2% |
| Interquartile Range (IQR) | 18.0% | 14.4% |
| Standard Deviation (Sample) | 12.1% | 15.8% |
| Standard Deviation (Population) | 12.0% | 15.7% |
Similar Demographics by In Labor Force | Age > 16
Demographics Similar to Central American Indians by In Labor Force | Age > 16
In terms of in labor force | age > 16, the demographic groups most similar to Central American Indians are Black/African American (63.4%, a difference of 0.030%), Pennsylvania German (63.4%, a difference of 0.050%), Osage (63.5%, a difference of 0.13%), Nonimmigrants (63.5%, a difference of 0.17%), and Scotch-Irish (63.3%, a difference of 0.17%).
| Demographics | Rating | Rank | In Labor Force | Age > 16 |
| Immigrants | Azores | 0.0 /100 | #300 | Tragic 63.6% |
| Spanish Americans | 0.0 /100 | #301 | Tragic 63.6% |
| Delaware | 0.0 /100 | #302 | Tragic 63.6% |
| Cree | 0.0 /100 | #303 | Tragic 63.5% |
| Immigrants | Nonimmigrants | 0.0 /100 | #304 | Tragic 63.5% |
| Osage | 0.0 /100 | #305 | Tragic 63.5% |
| Blacks/African Americans | 0.0 /100 | #306 | Tragic 63.4% |
| Central American Indians | 0.0 /100 | #307 | Tragic 63.4% |
| Pennsylvania Germans | 0.0 /100 | #308 | Tragic 63.4% |
| Scotch-Irish | 0.0 /100 | #309 | Tragic 63.3% |
| Shoshone | 0.0 /100 | #310 | Tragic 63.2% |
| Blackfeet | 0.0 /100 | #311 | Tragic 63.2% |
| Iroquois | 0.0 /100 | #312 | Tragic 63.2% |
| Chippewa | 0.0 /100 | #313 | Tragic 63.1% |
| Yaqui | 0.0 /100 | #314 | Tragic 63.0% |
Demographics Similar to Czechoslovakians by In Labor Force | Age > 16
In terms of in labor force | age > 16, the demographic groups most similar to Czechoslovakians are Immigrants from Uzbekistan (64.3%, a difference of 0.0%), Immigrants from Dominican Republic (64.4%, a difference of 0.010%), Portuguese (64.4%, a difference of 0.040%), British West Indian (64.4%, a difference of 0.060%), and German (64.4%, a difference of 0.070%).
| Demographics | Rating | Rank | In Labor Force | Age > 16 |
| Immigrants | Caribbean | 2.3 /100 | #246 | Tragic 64.4% |
| Swiss | 2.1 /100 | #247 | Tragic 64.4% |
| Immigrants | Barbados | 2.1 /100 | #248 | Tragic 64.4% |
| Germans | 1.8 /100 | #249 | Tragic 64.4% |
| British West Indians | 1.8 /100 | #250 | Tragic 64.4% |
| Portuguese | 1.6 /100 | #251 | Tragic 64.4% |
| Immigrants | Dominican Republic | 1.5 /100 | #252 | Tragic 64.4% |
| Czechoslovakians | 1.4 /100 | #253 | Tragic 64.3% |
| Immigrants | Uzbekistan | 1.4 /100 | #254 | Tragic 64.3% |
| Hispanics or Latinos | 1.1 /100 | #255 | Tragic 64.3% |
| Immigrants | Mexico | 1.0 /100 | #256 | Tragic 64.3% |
| Inupiat | 0.8 /100 | #257 | Tragic 64.3% |
| Immigrants | Scotland | 0.8 /100 | #258 | Tragic 64.2% |
| Immigrants | Western Europe | 0.7 /100 | #259 | Tragic 64.2% |
| Marshallese | 0.7 /100 | #260 | Tragic 64.2% |