Iraqi vs Czechoslovakian In Labor Force | Age > 16
COMPARE
Iraqi
Czechoslovakian
In Labor Force | Age > 16
In Labor Force | Age > 16 Comparison
Iraqis
Czechoslovakians
65.7%
IN LABOR FORCE | AGE > 16
95.4/ 100
METRIC RATING
124th/ 347
METRIC RANK
64.3%
IN LABOR FORCE | AGE > 16
1.4/ 100
METRIC RATING
253rd/ 347
METRIC RANK
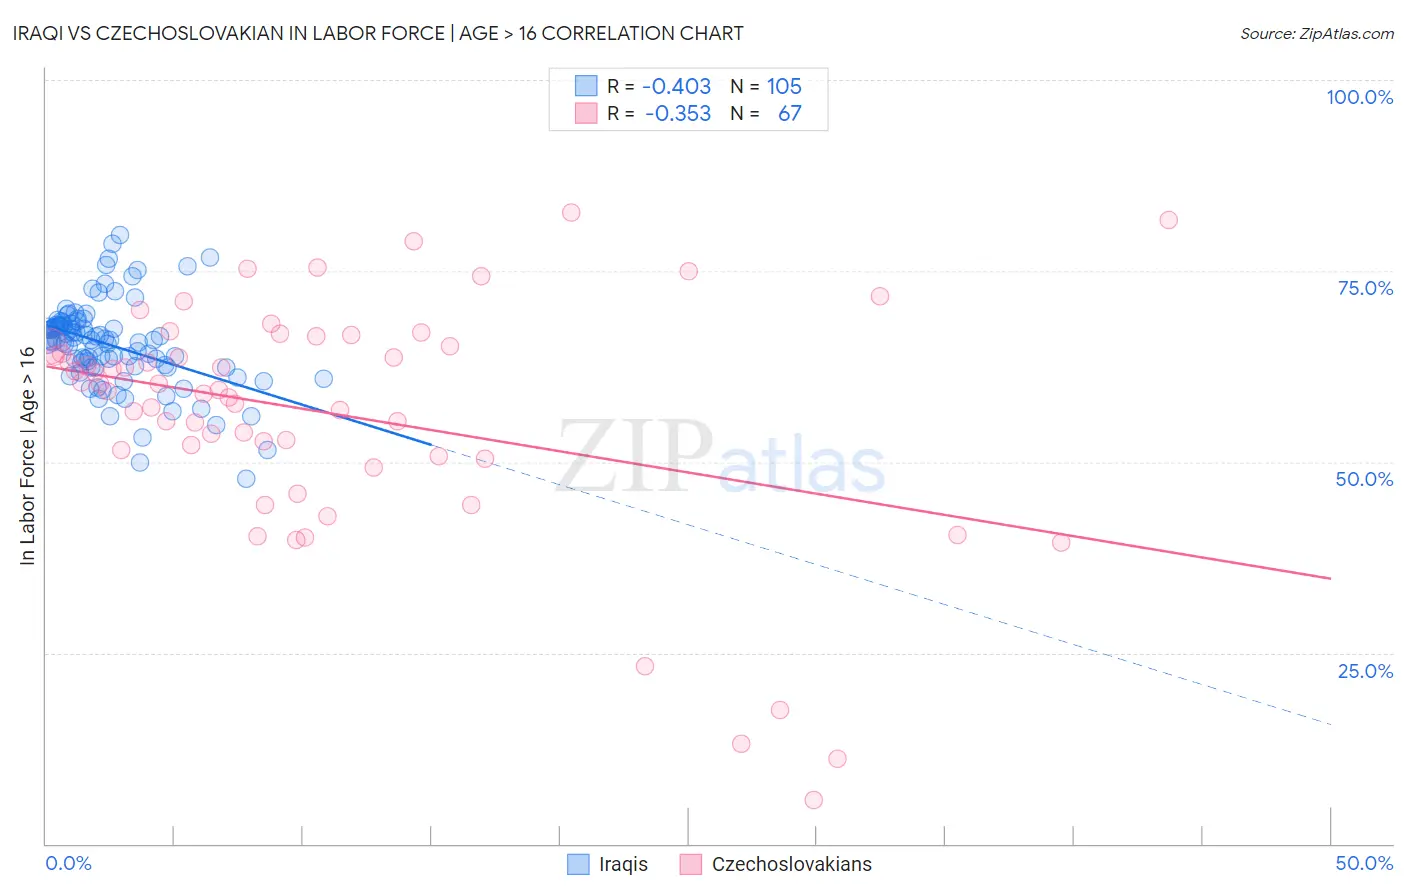
Iraqi vs Czechoslovakian In Labor Force | Age > 16 Correlation Chart
The statistical analysis conducted on geographies consisting of 170,648,723 people shows a moderate negative correlation between the proportion of Iraqis and labor force participation rate among population ages 16 and over in the United States with a correlation coefficient (R) of -0.403 and weighted average of 65.7%. Similarly, the statistical analysis conducted on geographies consisting of 368,673,303 people shows a mild negative correlation between the proportion of Czechoslovakians and labor force participation rate among population ages 16 and over in the United States with a correlation coefficient (R) of -0.353 and weighted average of 64.3%, a difference of 2.1%.
In Labor Force | Age > 16 Correlation Summary
| Measurement | Iraqi | Czechoslovakian |
| Minimum | 47.8% | 5.7% |
| Maximum | 79.7% | 82.7% |
| Range | 31.9% | 77.0% |
| Mean | 65.3% | 56.3% |
| Median | 65.9% | 59.4% |
| Interquartile 25% (IQ1) | 62.4% | 50.8% |
| Interquartile 75% (IQ3) | 67.9% | 65.2% |
| Interquartile Range (IQR) | 5.5% | 14.4% |
| Standard Deviation (Sample) | 5.7% | 15.8% |
| Standard Deviation (Population) | 5.7% | 15.7% |
Similar Demographics by In Labor Force | Age > 16
Demographics Similar to Iraqis by In Labor Force | Age > 16
In terms of in labor force | age > 16, the demographic groups most similar to Iraqis are Immigrants from Iraq (65.7%, a difference of 0.0%), Norwegian (65.7%, a difference of 0.010%), Korean (65.7%, a difference of 0.010%), Immigrants from Ecuador (65.7%, a difference of 0.030%), and Immigrants from Eastern Asia (65.7%, a difference of 0.030%).
| Demographics | Rating | Rank | In Labor Force | Age > 16 |
| Immigrants | Iran | 96.6 /100 | #117 | Exceptional 65.7% |
| Immigrants | Thailand | 96.6 /100 | #118 | Exceptional 65.7% |
| Immigrants | France | 96.4 /100 | #119 | Exceptional 65.7% |
| Immigrants | Hong Kong | 96.2 /100 | #120 | Exceptional 65.7% |
| New Zealanders | 96.0 /100 | #121 | Exceptional 65.7% |
| Immigrants | Ecuador | 95.9 /100 | #122 | Exceptional 65.7% |
| Immigrants | Iraq | 95.5 /100 | #123 | Exceptional 65.7% |
| Iraqis | 95.4 /100 | #124 | Exceptional 65.7% |
| Norwegians | 95.3 /100 | #125 | Exceptional 65.7% |
| Koreans | 95.3 /100 | #126 | Exceptional 65.7% |
| Immigrants | Eastern Asia | 94.9 /100 | #127 | Exceptional 65.7% |
| Ecuadorians | 94.7 /100 | #128 | Exceptional 65.6% |
| Immigrants | Philippines | 94.5 /100 | #129 | Exceptional 65.6% |
| Immigrants | Guatemala | 94.4 /100 | #130 | Exceptional 65.6% |
| Icelanders | 94.3 /100 | #131 | Exceptional 65.6% |
Demographics Similar to Czechoslovakians by In Labor Force | Age > 16
In terms of in labor force | age > 16, the demographic groups most similar to Czechoslovakians are Immigrants from Uzbekistan (64.3%, a difference of 0.0%), Immigrants from Dominican Republic (64.4%, a difference of 0.010%), Portuguese (64.4%, a difference of 0.040%), British West Indian (64.4%, a difference of 0.060%), and German (64.4%, a difference of 0.070%).
| Demographics | Rating | Rank | In Labor Force | Age > 16 |
| Immigrants | Caribbean | 2.3 /100 | #246 | Tragic 64.4% |
| Swiss | 2.1 /100 | #247 | Tragic 64.4% |
| Immigrants | Barbados | 2.1 /100 | #248 | Tragic 64.4% |
| Germans | 1.8 /100 | #249 | Tragic 64.4% |
| British West Indians | 1.8 /100 | #250 | Tragic 64.4% |
| Portuguese | 1.6 /100 | #251 | Tragic 64.4% |
| Immigrants | Dominican Republic | 1.5 /100 | #252 | Tragic 64.4% |
| Czechoslovakians | 1.4 /100 | #253 | Tragic 64.3% |
| Immigrants | Uzbekistan | 1.4 /100 | #254 | Tragic 64.3% |
| Hispanics or Latinos | 1.1 /100 | #255 | Tragic 64.3% |
| Immigrants | Mexico | 1.0 /100 | #256 | Tragic 64.3% |
| Inupiat | 0.8 /100 | #257 | Tragic 64.3% |
| Immigrants | Scotland | 0.8 /100 | #258 | Tragic 64.2% |
| Immigrants | Western Europe | 0.7 /100 | #259 | Tragic 64.2% |
| Marshallese | 0.7 /100 | #260 | Tragic 64.2% |