Immigrants from Bosnia and Herzegovina vs German In Labor Force | Age 35-44
COMPARE
Immigrants from Bosnia and Herzegovina
German
In Labor Force | Age 35-44
In Labor Force | Age 35-44 Comparison
Immigrants from Bosnia and Herzegovina
Germans
85.4%
IN LABOR FORCE | AGE 35-44
100.0/ 100
METRIC RATING
22nd/ 347
METRIC RANK
84.7%
IN LABOR FORCE | AGE 35-44
91.0/ 100
METRIC RATING
122nd/ 347
METRIC RANK
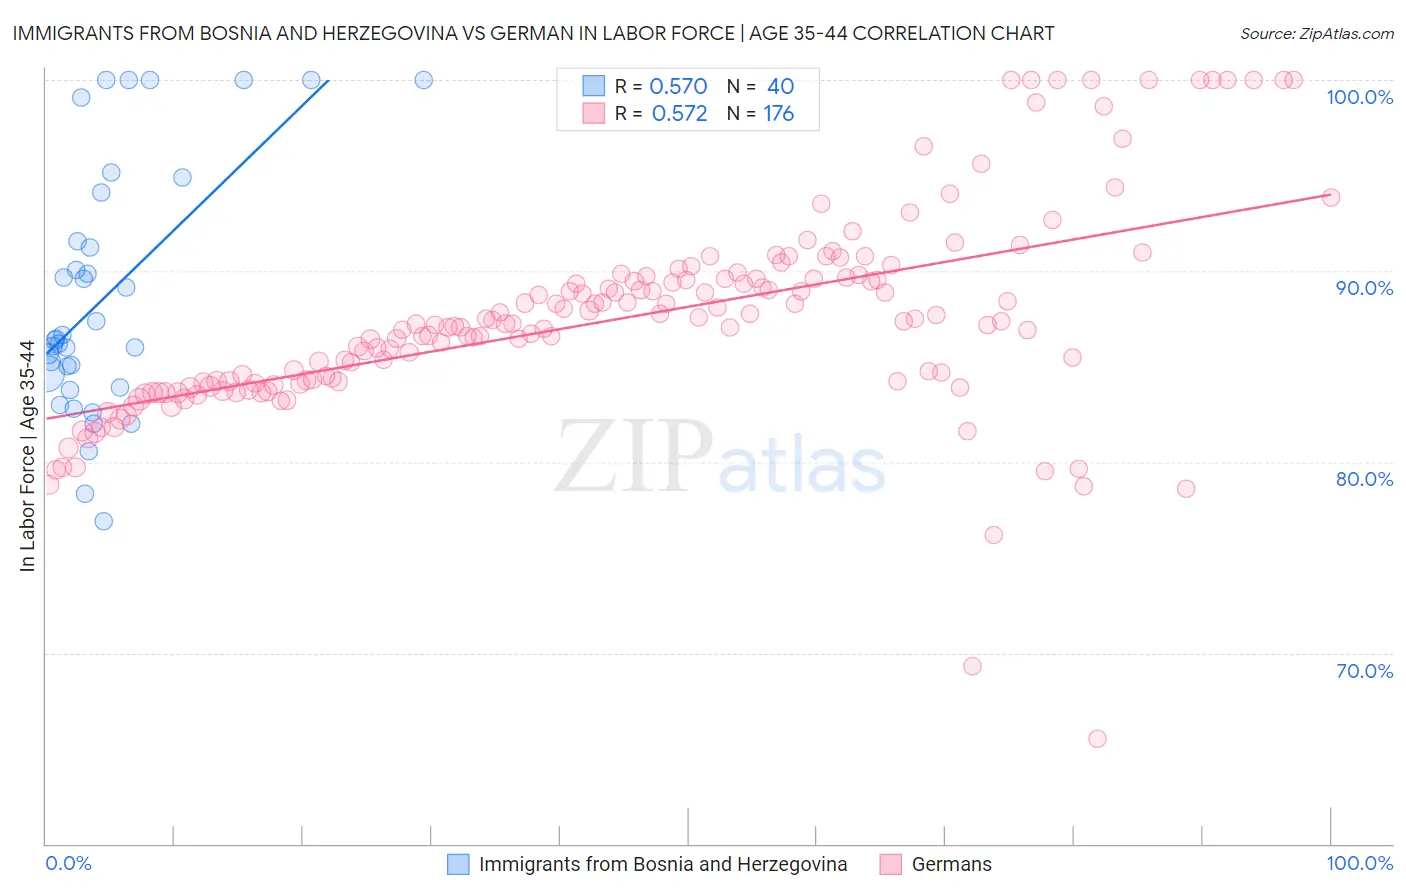
Immigrants from Bosnia and Herzegovina vs German In Labor Force | Age 35-44 Correlation Chart
The statistical analysis conducted on geographies consisting of 156,807,343 people shows a substantial positive correlation between the proportion of Immigrants from Bosnia and Herzegovina and labor force participation rate among population between the ages 35 and 44 in the United States with a correlation coefficient (R) of 0.570 and weighted average of 85.4%. Similarly, the statistical analysis conducted on geographies consisting of 580,230,467 people shows a substantial positive correlation between the proportion of Germans and labor force participation rate among population between the ages 35 and 44 in the United States with a correlation coefficient (R) of 0.572 and weighted average of 84.7%, a difference of 0.89%.
In Labor Force | Age 35-44 Correlation Summary
| Measurement | Immigrants from Bosnia and Herzegovina | German |
| Minimum | 76.9% | 65.5% |
| Maximum | 100.0% | 100.0% |
| Range | 23.1% | 34.5% |
| Mean | 88.7% | 87.5% |
| Median | 86.4% | 87.2% |
| Interquartile 25% (IQ1) | 84.3% | 84.1% |
| Interquartile 75% (IQ3) | 92.8% | 89.6% |
| Interquartile Range (IQR) | 8.6% | 5.5% |
| Standard Deviation (Sample) | 6.5% | 5.4% |
| Standard Deviation (Population) | 6.5% | 5.4% |
Similar Demographics by In Labor Force | Age 35-44
Demographics Similar to Immigrants from Bosnia and Herzegovina by In Labor Force | Age 35-44
In terms of in labor force | age 35-44, the demographic groups most similar to Immigrants from Bosnia and Herzegovina are Immigrants from Eastern Africa (85.4%, a difference of 0.020%), Bulgarian (85.5%, a difference of 0.040%), Latvian (85.4%, a difference of 0.080%), Paraguayan (85.4%, a difference of 0.090%), and Immigrants from Liberia (85.4%, a difference of 0.090%).
| Demographics | Rating | Rank | In Labor Force | Age 35-44 |
| Norwegians | 100.0 /100 | #15 | Exceptional 85.6% |
| Immigrants | Ireland | 100.0 /100 | #16 | Exceptional 85.6% |
| Immigrants | North Macedonia | 100.0 /100 | #17 | Exceptional 85.6% |
| Carpatho Rusyns | 100.0 /100 | #18 | Exceptional 85.6% |
| Slovenes | 100.0 /100 | #19 | Exceptional 85.6% |
| Immigrants | Serbia | 100.0 /100 | #20 | Exceptional 85.5% |
| Bulgarians | 100.0 /100 | #21 | Exceptional 85.5% |
| Immigrants | Bosnia and Herzegovina | 100.0 /100 | #22 | Exceptional 85.4% |
| Immigrants | Eastern Africa | 100.0 /100 | #23 | Exceptional 85.4% |
| Latvians | 99.9 /100 | #24 | Exceptional 85.4% |
| Paraguayans | 99.9 /100 | #25 | Exceptional 85.4% |
| Immigrants | Liberia | 99.9 /100 | #26 | Exceptional 85.4% |
| Immigrants | Lithuania | 99.9 /100 | #27 | Exceptional 85.4% |
| Immigrants | Greece | 99.9 /100 | #28 | Exceptional 85.3% |
| Cambodians | 99.9 /100 | #29 | Exceptional 85.3% |
Demographics Similar to Germans by In Labor Force | Age 35-44
In terms of in labor force | age 35-44, the demographic groups most similar to Germans are Finnish (84.7%, a difference of 0.0%), Immigrants from South America (84.7%, a difference of 0.0%), Slavic (84.7%, a difference of 0.0%), Burmese (84.7%, a difference of 0.010%), and Immigrants from Northern Europe (84.7%, a difference of 0.010%).
| Demographics | Rating | Rank | In Labor Force | Age 35-44 |
| Bahamians | 93.2 /100 | #115 | Exceptional 84.7% |
| Immigrants | Egypt | 92.7 /100 | #116 | Exceptional 84.7% |
| Immigrants | China | 92.3 /100 | #117 | Exceptional 84.7% |
| Immigrants | Eastern Asia | 92.1 /100 | #118 | Exceptional 84.7% |
| Burmese | 91.8 /100 | #119 | Exceptional 84.7% |
| Immigrants | Northern Europe | 91.5 /100 | #120 | Exceptional 84.7% |
| Finns | 91.2 /100 | #121 | Exceptional 84.7% |
| Germans | 91.0 /100 | #122 | Exceptional 84.7% |
| Immigrants | South America | 90.9 /100 | #123 | Exceptional 84.7% |
| Slavs | 90.8 /100 | #124 | Exceptional 84.7% |
| Maltese | 90.8 /100 | #125 | Exceptional 84.7% |
| Asians | 90.6 /100 | #126 | Exceptional 84.7% |
| Immigrants | Spain | 90.6 /100 | #127 | Exceptional 84.7% |
| Immigrants | Ghana | 90.4 /100 | #128 | Exceptional 84.7% |
| Palestinians | 89.7 /100 | #129 | Excellent 84.7% |