Immigrants from Bosnia and Herzegovina vs Mexican American Indian In Labor Force | Age 35-44
COMPARE
Immigrants from Bosnia and Herzegovina
Mexican American Indian
In Labor Force | Age 35-44
In Labor Force | Age 35-44 Comparison
Immigrants from Bosnia and Herzegovina
Mexican American Indians
85.4%
IN LABOR FORCE | AGE 35-44
100.0/ 100
METRIC RATING
22nd/ 347
METRIC RANK
82.6%
IN LABOR FORCE | AGE 35-44
0.0/ 100
METRIC RATING
296th/ 347
METRIC RANK
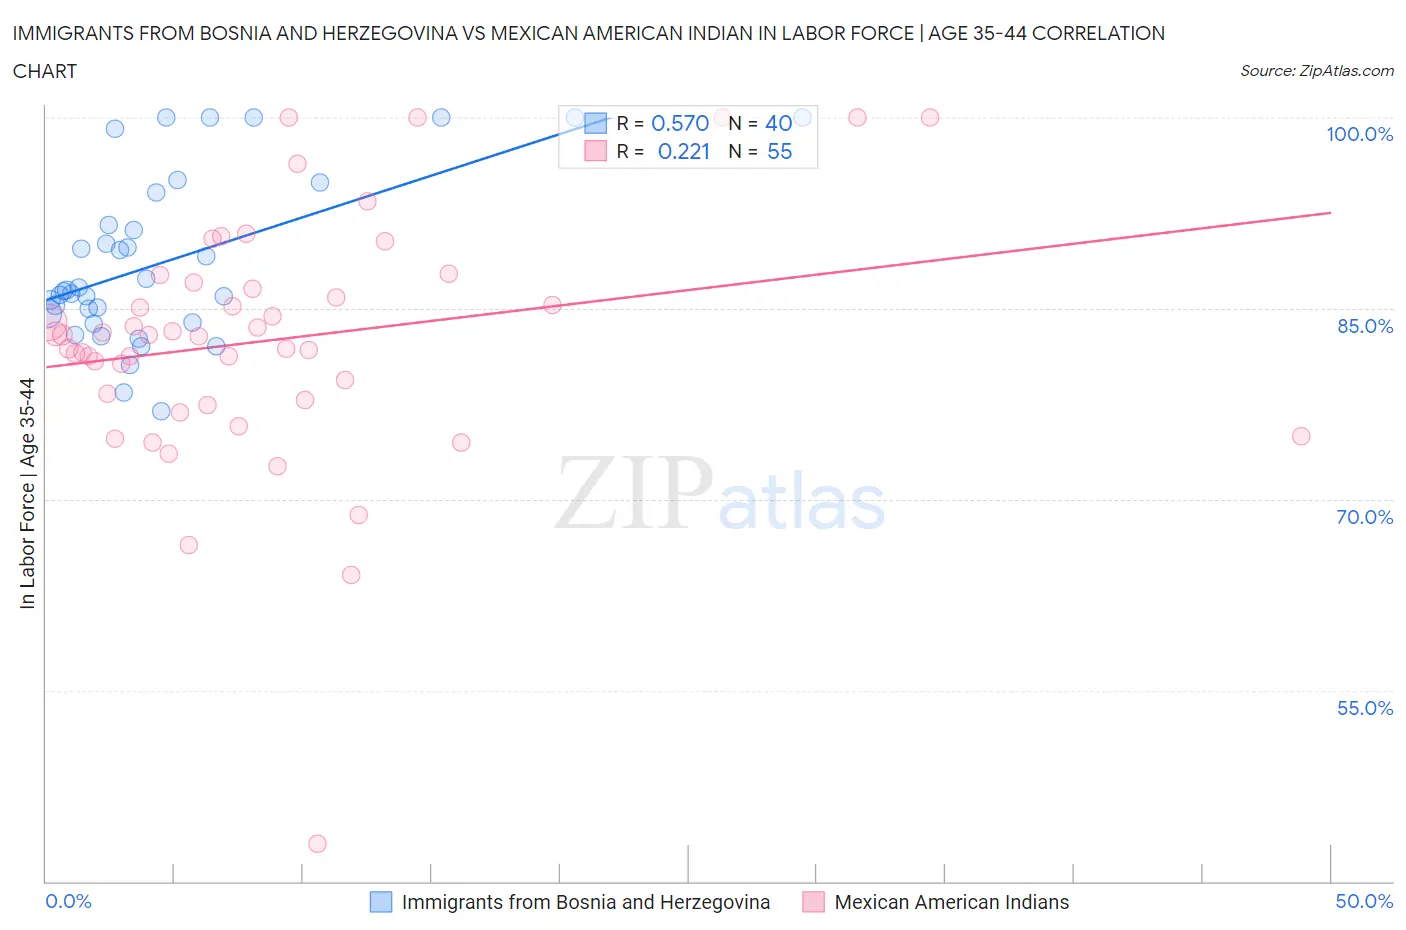
Immigrants from Bosnia and Herzegovina vs Mexican American Indian In Labor Force | Age 35-44 Correlation Chart
The statistical analysis conducted on geographies consisting of 156,807,343 people shows a substantial positive correlation between the proportion of Immigrants from Bosnia and Herzegovina and labor force participation rate among population between the ages 35 and 44 in the United States with a correlation coefficient (R) of 0.570 and weighted average of 85.4%. Similarly, the statistical analysis conducted on geographies consisting of 317,545,912 people shows a weak positive correlation between the proportion of Mexican American Indians and labor force participation rate among population between the ages 35 and 44 in the United States with a correlation coefficient (R) of 0.221 and weighted average of 82.6%, a difference of 3.5%.
In Labor Force | Age 35-44 Correlation Summary
| Measurement | Immigrants from Bosnia and Herzegovina | Mexican American Indian |
| Minimum | 76.9% | 42.9% |
| Maximum | 100.0% | 100.0% |
| Range | 23.1% | 57.1% |
| Mean | 88.7% | 82.6% |
| Median | 86.4% | 82.9% |
| Interquartile 25% (IQ1) | 84.3% | 77.8% |
| Interquartile 75% (IQ3) | 92.8% | 87.0% |
| Interquartile Range (IQR) | 8.6% | 9.2% |
| Standard Deviation (Sample) | 6.5% | 9.8% |
| Standard Deviation (Population) | 6.5% | 9.7% |
Similar Demographics by In Labor Force | Age 35-44
Demographics Similar to Immigrants from Bosnia and Herzegovina by In Labor Force | Age 35-44
In terms of in labor force | age 35-44, the demographic groups most similar to Immigrants from Bosnia and Herzegovina are Immigrants from Eastern Africa (85.4%, a difference of 0.020%), Bulgarian (85.5%, a difference of 0.040%), Latvian (85.4%, a difference of 0.080%), Paraguayan (85.4%, a difference of 0.090%), and Immigrants from Liberia (85.4%, a difference of 0.090%).
| Demographics | Rating | Rank | In Labor Force | Age 35-44 |
| Norwegians | 100.0 /100 | #15 | Exceptional 85.6% |
| Immigrants | Ireland | 100.0 /100 | #16 | Exceptional 85.6% |
| Immigrants | North Macedonia | 100.0 /100 | #17 | Exceptional 85.6% |
| Carpatho Rusyns | 100.0 /100 | #18 | Exceptional 85.6% |
| Slovenes | 100.0 /100 | #19 | Exceptional 85.6% |
| Immigrants | Serbia | 100.0 /100 | #20 | Exceptional 85.5% |
| Bulgarians | 100.0 /100 | #21 | Exceptional 85.5% |
| Immigrants | Bosnia and Herzegovina | 100.0 /100 | #22 | Exceptional 85.4% |
| Immigrants | Eastern Africa | 100.0 /100 | #23 | Exceptional 85.4% |
| Latvians | 99.9 /100 | #24 | Exceptional 85.4% |
| Paraguayans | 99.9 /100 | #25 | Exceptional 85.4% |
| Immigrants | Liberia | 99.9 /100 | #26 | Exceptional 85.4% |
| Immigrants | Lithuania | 99.9 /100 | #27 | Exceptional 85.4% |
| Immigrants | Greece | 99.9 /100 | #28 | Exceptional 85.3% |
| Cambodians | 99.9 /100 | #29 | Exceptional 85.3% |
Demographics Similar to Mexican American Indians by In Labor Force | Age 35-44
In terms of in labor force | age 35-44, the demographic groups most similar to Mexican American Indians are Hmong (82.6%, a difference of 0.010%), Ottawa (82.6%, a difference of 0.020%), Tlingit-Haida (82.5%, a difference of 0.040%), Immigrants from Lebanon (82.7%, a difference of 0.10%), and Central American Indian (82.5%, a difference of 0.10%).
| Demographics | Rating | Rank | In Labor Force | Age 35-44 |
| Chippewa | 0.0 /100 | #289 | Tragic 82.9% |
| Africans | 0.0 /100 | #290 | Tragic 82.9% |
| Pennsylvania Germans | 0.0 /100 | #291 | Tragic 82.9% |
| Immigrants | Latin America | 0.0 /100 | #292 | Tragic 82.8% |
| Spanish Americans | 0.0 /100 | #293 | Tragic 82.8% |
| Potawatomi | 0.0 /100 | #294 | Tragic 82.7% |
| Immigrants | Lebanon | 0.0 /100 | #295 | Tragic 82.7% |
| Mexican American Indians | 0.0 /100 | #296 | Tragic 82.6% |
| Hmong | 0.0 /100 | #297 | Tragic 82.6% |
| Ottawa | 0.0 /100 | #298 | Tragic 82.6% |
| Tlingit-Haida | 0.0 /100 | #299 | Tragic 82.5% |
| Central American Indians | 0.0 /100 | #300 | Tragic 82.5% |
| Spanish American Indians | 0.0 /100 | #301 | Tragic 82.5% |
| Americans | 0.0 /100 | #302 | Tragic 82.4% |
| Nepalese | 0.0 /100 | #303 | Tragic 82.4% |