Hungarian vs Okinawan In Labor Force | Age 35-44
COMPARE
Hungarian
Okinawan
In Labor Force | Age 35-44
In Labor Force | Age 35-44 Comparison
Hungarians
Okinawans
84.2%
IN LABOR FORCE | AGE 35-44
26.8/ 100
METRIC RATING
193rd/ 347
METRIC RANK
84.5%
IN LABOR FORCE | AGE 35-44
73.5/ 100
METRIC RATING
149th/ 347
METRIC RANK
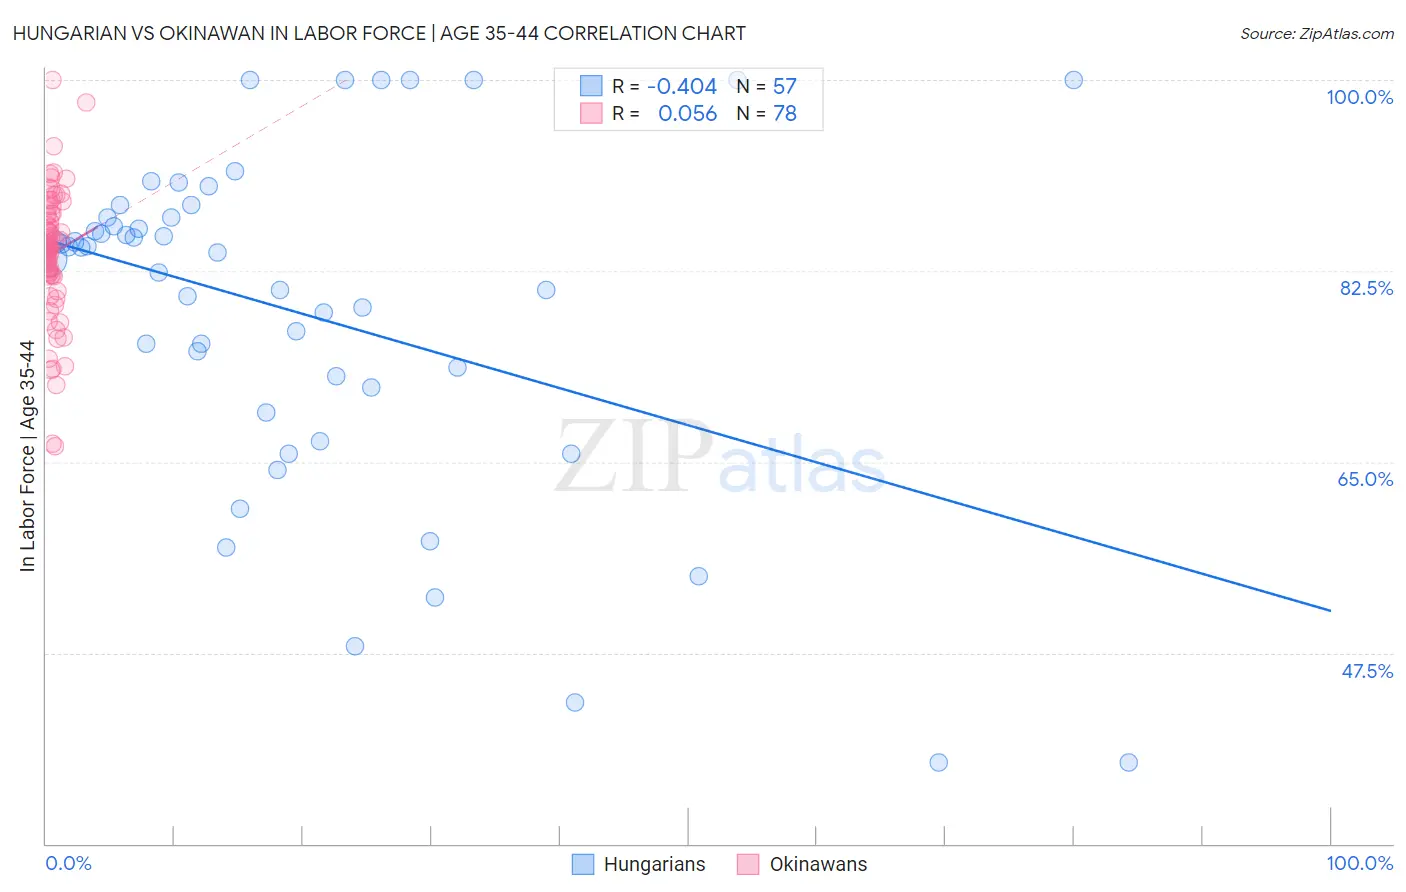
Hungarian vs Okinawan In Labor Force | Age 35-44 Correlation Chart
The statistical analysis conducted on geographies consisting of 485,922,886 people shows a moderate negative correlation between the proportion of Hungarians and labor force participation rate among population between the ages 35 and 44 in the United States with a correlation coefficient (R) of -0.404 and weighted average of 84.2%. Similarly, the statistical analysis conducted on geographies consisting of 73,734,872 people shows a slight positive correlation between the proportion of Okinawans and labor force participation rate among population between the ages 35 and 44 in the United States with a correlation coefficient (R) of 0.056 and weighted average of 84.5%, a difference of 0.33%.
In Labor Force | Age 35-44 Correlation Summary
| Measurement | Hungarian | Okinawan |
| Minimum | 37.5% | 66.4% |
| Maximum | 100.0% | 100.0% |
| Range | 62.5% | 33.6% |
| Mean | 78.6% | 84.1% |
| Median | 84.2% | 84.6% |
| Interquartile 25% (IQ1) | 70.7% | 82.1% |
| Interquartile 75% (IQ3) | 87.4% | 87.7% |
| Interquartile Range (IQR) | 16.7% | 5.6% |
| Standard Deviation (Sample) | 15.7% | 5.9% |
| Standard Deviation (Population) | 15.6% | 5.9% |
Similar Demographics by In Labor Force | Age 35-44
Demographics Similar to Hungarians by In Labor Force | Age 35-44
In terms of in labor force | age 35-44, the demographic groups most similar to Hungarians are Immigrants from Philippines (84.2%, a difference of 0.010%), Immigrants from Vietnam (84.2%, a difference of 0.010%), Immigrants from Indonesia (84.2%, a difference of 0.010%), Immigrants from Caribbean (84.2%, a difference of 0.010%), and Immigrants from England (84.2%, a difference of 0.010%).
| Demographics | Rating | Rank | In Labor Force | Age 35-44 |
| Australians | 35.1 /100 | #186 | Fair 84.3% |
| Dutch | 34.8 /100 | #187 | Fair 84.3% |
| South Africans | 34.1 /100 | #188 | Fair 84.3% |
| Immigrants | Denmark | 33.7 /100 | #189 | Fair 84.3% |
| Portuguese | 31.9 /100 | #190 | Fair 84.3% |
| Immigrants | Philippines | 27.9 /100 | #191 | Fair 84.2% |
| Immigrants | Vietnam | 27.4 /100 | #192 | Fair 84.2% |
| Hungarians | 26.8 /100 | #193 | Fair 84.2% |
| Immigrants | Indonesia | 25.7 /100 | #194 | Fair 84.2% |
| Immigrants | Caribbean | 25.7 /100 | #195 | Fair 84.2% |
| Immigrants | England | 25.0 /100 | #196 | Fair 84.2% |
| Immigrants | Western Europe | 24.7 /100 | #197 | Fair 84.2% |
| Ecuadorians | 24.0 /100 | #198 | Fair 84.2% |
| Syrians | 23.2 /100 | #199 | Fair 84.2% |
| Moroccans | 23.2 /100 | #200 | Fair 84.2% |
Demographics Similar to Okinawans by In Labor Force | Age 35-44
In terms of in labor force | age 35-44, the demographic groups most similar to Okinawans are South American Indian (84.5%, a difference of 0.0%), Immigrants from Nigeria (84.5%, a difference of 0.0%), Romanian (84.5%, a difference of 0.010%), Immigrants from Taiwan (84.5%, a difference of 0.020%), and Immigrants from Netherlands (84.5%, a difference of 0.030%).
| Demographics | Rating | Rank | In Labor Force | Age 35-44 |
| Immigrants | Uruguay | 80.1 /100 | #142 | Excellent 84.6% |
| Immigrants | Ukraine | 79.7 /100 | #143 | Good 84.6% |
| Immigrants | Jamaica | 79.4 /100 | #144 | Good 84.6% |
| Immigrants | Saudi Arabia | 79.4 /100 | #145 | Good 84.6% |
| Immigrants | Asia | 78.7 /100 | #146 | Good 84.5% |
| Immigrants | Netherlands | 76.6 /100 | #147 | Good 84.5% |
| South American Indians | 73.6 /100 | #148 | Good 84.5% |
| Okinawans | 73.5 /100 | #149 | Good 84.5% |
| Immigrants | Nigeria | 73.3 /100 | #150 | Good 84.5% |
| Romanians | 72.1 /100 | #151 | Good 84.5% |
| Immigrants | Taiwan | 71.4 /100 | #152 | Good 84.5% |
| Trinidadians and Tobagonians | 69.5 /100 | #153 | Good 84.5% |
| Iranians | 69.4 /100 | #154 | Good 84.5% |
| Immigrants | Switzerland | 65.9 /100 | #155 | Good 84.5% |
| Immigrants | Israel | 64.3 /100 | #156 | Good 84.4% |