Hungarian vs Okinawan Births to Unmarried Women
COMPARE
Hungarian
Okinawan
Births to Unmarried Women
Births to Unmarried Women Comparison
Hungarians
Okinawans
31.2%
BIRTHS TO UNMARRIED WOMEN
64.1/ 100
METRIC RATING
164th/ 347
METRIC RANK
26.9%
BIRTHS TO UNMARRIED WOMEN
99.8/ 100
METRIC RATING
28th/ 347
METRIC RANK
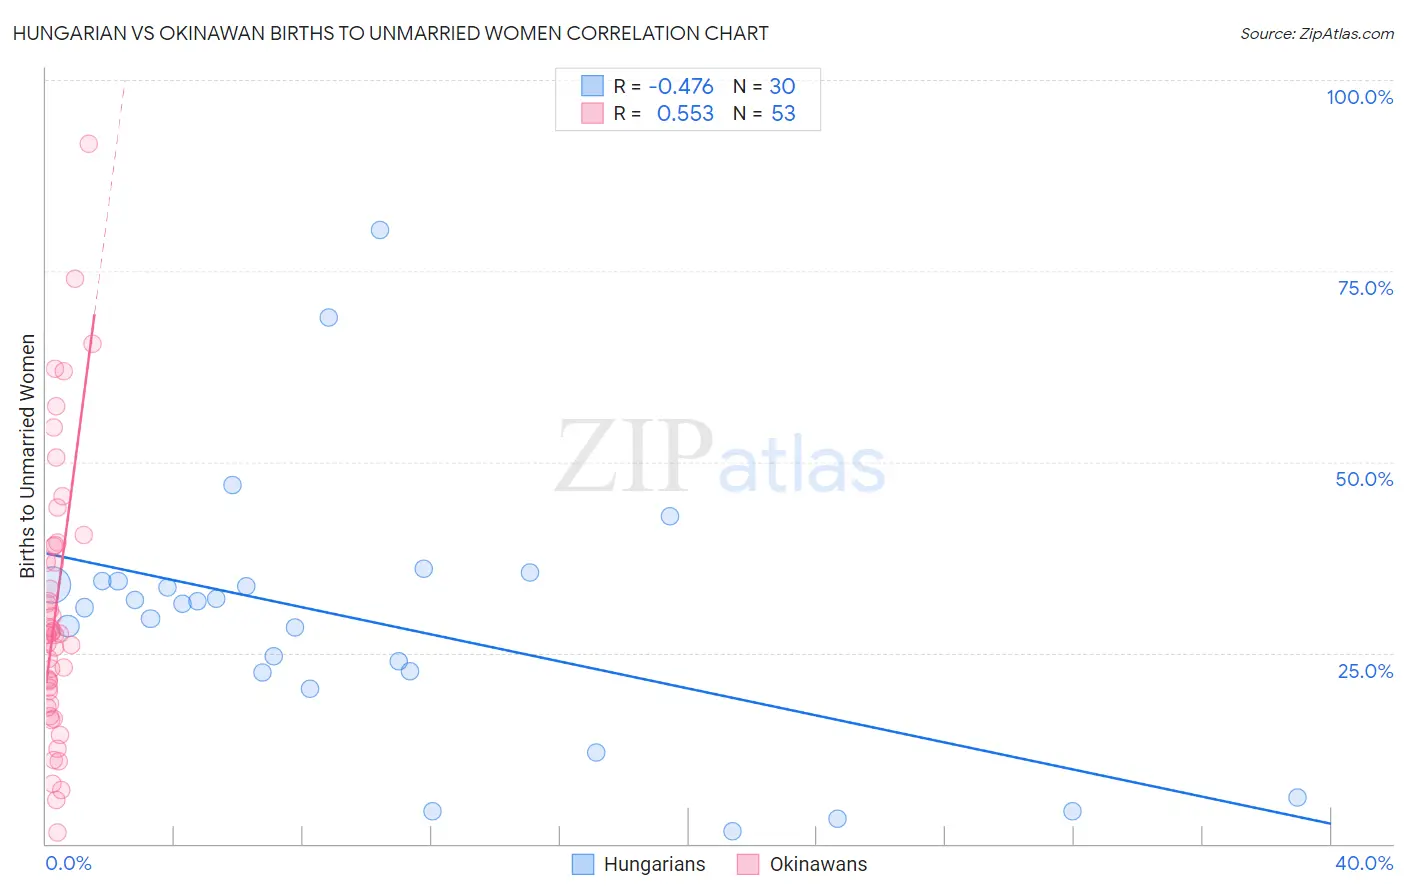
Hungarian vs Okinawan Births to Unmarried Women Correlation Chart
The statistical analysis conducted on geographies consisting of 440,971,373 people shows a moderate negative correlation between the proportion of Hungarians and percentage of births to unmarried women in the United States with a correlation coefficient (R) of -0.476 and weighted average of 31.2%. Similarly, the statistical analysis conducted on geographies consisting of 71,741,584 people shows a substantial positive correlation between the proportion of Okinawans and percentage of births to unmarried women in the United States with a correlation coefficient (R) of 0.553 and weighted average of 26.9%, a difference of 16.0%.
Births to Unmarried Women Correlation Summary
| Measurement | Hungarian | Okinawan |
| Minimum | 1.6% | 1.4% |
| Maximum | 80.4% | 91.7% |
| Range | 78.8% | 90.3% |
| Mean | 29.0% | 30.7% |
| Median | 31.2% | 27.4% |
| Interquartile 25% (IQ1) | 22.4% | 19.2% |
| Interquartile 75% (IQ3) | 34.3% | 39.0% |
| Interquartile Range (IQR) | 12.0% | 19.9% |
| Standard Deviation (Sample) | 17.3% | 18.0% |
| Standard Deviation (Population) | 17.0% | 17.8% |
Similar Demographics by Births to Unmarried Women
Demographics Similar to Hungarians by Births to Unmarried Women
In terms of births to unmarried women, the demographic groups most similar to Hungarians are Immigrants from Chile (31.2%, a difference of 0.17%), Slovene (31.2%, a difference of 0.19%), Immigrants from Southern Europe (31.1%, a difference of 0.50%), Immigrants from England (31.1%, a difference of 0.57%), and Immigrants from Western Europe (31.1%, a difference of 0.57%).
| Demographics | Rating | Rank | Births to Unmarried Women |
| Immigrants | Eastern Africa | 72.1 /100 | #157 | Good 31.0% |
| Austrians | 69.9 /100 | #158 | Good 31.0% |
| Immigrants | England | 69.4 /100 | #159 | Good 31.1% |
| Immigrants | Western Europe | 69.3 /100 | #160 | Good 31.1% |
| Immigrants | Southern Europe | 68.7 /100 | #161 | Good 31.1% |
| Slovenes | 65.9 /100 | #162 | Good 31.2% |
| Immigrants | Chile | 65.7 /100 | #163 | Good 31.2% |
| Hungarians | 64.1 /100 | #164 | Good 31.2% |
| Immigrants | Somalia | 58.1 /100 | #165 | Average 31.4% |
| Peruvians | 55.5 /100 | #166 | Average 31.5% |
| Dutch | 55.3 /100 | #167 | Average 31.5% |
| Belgians | 52.4 /100 | #168 | Average 31.6% |
| Slavs | 52.0 /100 | #169 | Average 31.6% |
| Guamanians/Chamorros | 51.3 /100 | #170 | Average 31.6% |
| Finns | 50.5 /100 | #171 | Average 31.7% |
Demographics Similar to Okinawans by Births to Unmarried Women
In terms of births to unmarried women, the demographic groups most similar to Okinawans are Cypriot (27.0%, a difference of 0.36%), Immigrants from Asia (26.8%, a difference of 0.51%), Asian (26.8%, a difference of 0.52%), Bulgarian (27.1%, a difference of 0.52%), and Immigrants from Iraq (27.1%, a difference of 0.81%).
| Demographics | Rating | Rank | Births to Unmarried Women |
| Soviet Union | 99.9 /100 | #21 | Exceptional 26.3% |
| Burmese | 99.9 /100 | #22 | Exceptional 26.4% |
| Immigrants | Japan | 99.9 /100 | #23 | Exceptional 26.4% |
| Immigrants | Australia | 99.9 /100 | #24 | Exceptional 26.6% |
| Cambodians | 99.9 /100 | #25 | Exceptional 26.7% |
| Asians | 99.9 /100 | #26 | Exceptional 26.8% |
| Immigrants | Asia | 99.9 /100 | #27 | Exceptional 26.8% |
| Okinawans | 99.8 /100 | #28 | Exceptional 26.9% |
| Cypriots | 99.8 /100 | #29 | Exceptional 27.0% |
| Bulgarians | 99.8 /100 | #30 | Exceptional 27.1% |
| Immigrants | Iraq | 99.8 /100 | #31 | Exceptional 27.1% |
| Immigrants | Russia | 99.8 /100 | #32 | Exceptional 27.1% |
| Immigrants | Sri Lanka | 99.8 /100 | #33 | Exceptional 27.2% |
| Immigrants | Pakistan | 99.8 /100 | #34 | Exceptional 27.2% |
| Immigrants | Ireland | 99.7 /100 | #35 | Exceptional 27.2% |