Hungarian vs Okinawan Disability Age Over 75
COMPARE
Hungarian
Okinawan
Disability Age Over 75
Disability Age Over 75 Comparison
Hungarians
Okinawans
46.5%
DISABILITY AGE OVER 75
95.3/ 100
METRIC RATING
117th/ 347
METRIC RANK
44.9%
DISABILITY AGE OVER 75
100.0/ 100
METRIC RATING
7th/ 347
METRIC RANK
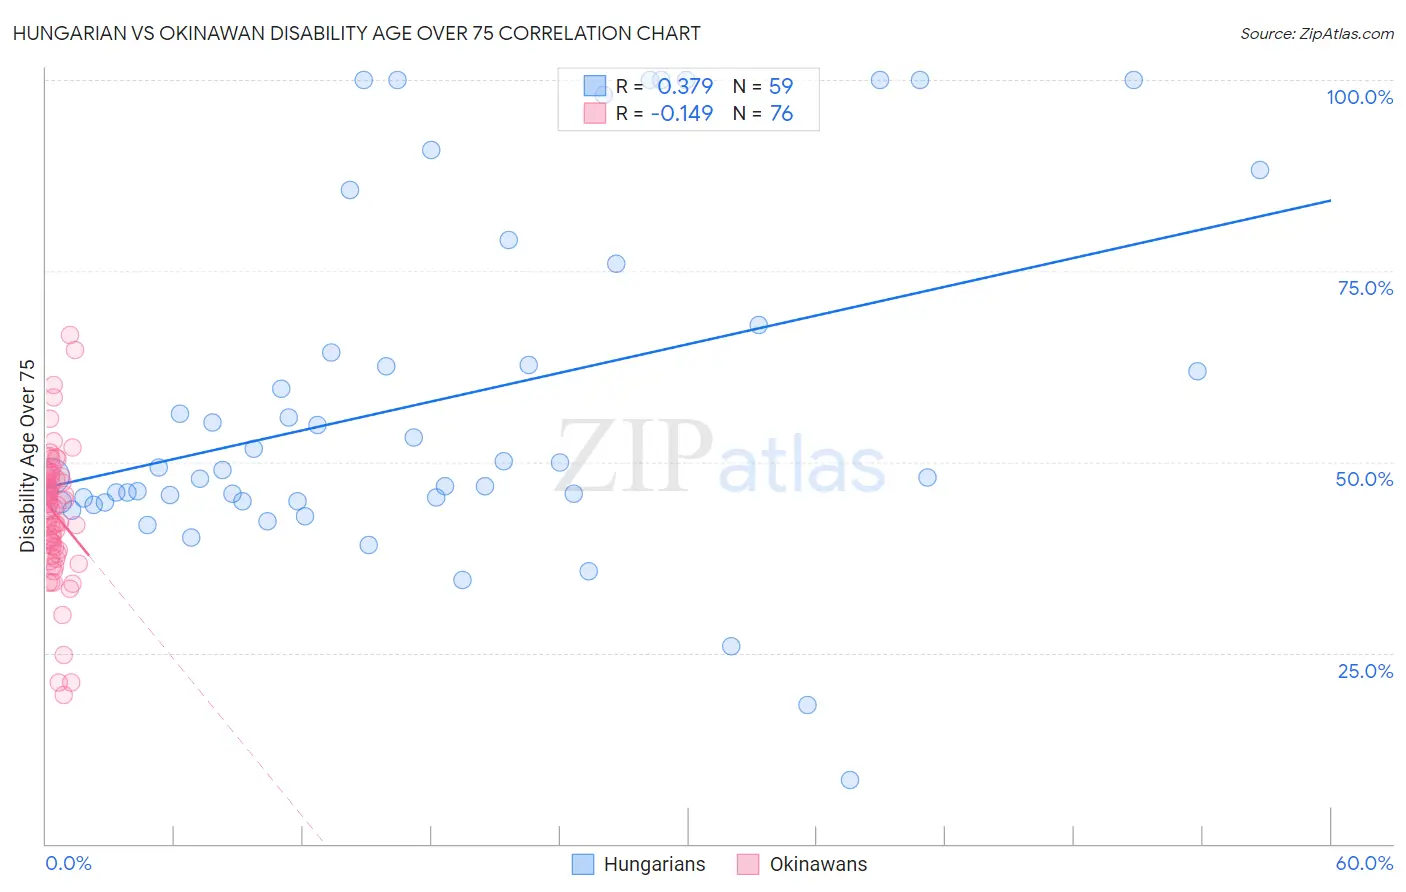
Hungarian vs Okinawan Disability Age Over 75 Correlation Chart
The statistical analysis conducted on geographies consisting of 485,150,017 people shows a mild positive correlation between the proportion of Hungarians and percentage of population with a disability over the age of 75 in the United States with a correlation coefficient (R) of 0.379 and weighted average of 46.5%. Similarly, the statistical analysis conducted on geographies consisting of 73,696,171 people shows a poor negative correlation between the proportion of Okinawans and percentage of population with a disability over the age of 75 in the United States with a correlation coefficient (R) of -0.149 and weighted average of 44.9%, a difference of 3.7%.
Disability Age Over 75 Correlation Summary
| Measurement | Hungarian | Okinawan |
| Minimum | 8.3% | 19.4% |
| Maximum | 100.0% | 66.7% |
| Range | 91.7% | 47.2% |
| Mean | 58.0% | 43.2% |
| Median | 48.9% | 44.2% |
| Interquartile 25% (IQ1) | 44.8% | 38.6% |
| Interquartile 75% (IQ3) | 67.9% | 48.1% |
| Interquartile Range (IQR) | 23.1% | 9.5% |
| Standard Deviation (Sample) | 22.8% | 8.5% |
| Standard Deviation (Population) | 22.6% | 8.5% |
Similar Demographics by Disability Age Over 75
Demographics Similar to Hungarians by Disability Age Over 75
In terms of disability age over 75, the demographic groups most similar to Hungarians are British (46.5%, a difference of 0.060%), Indian (Asian) (46.5%, a difference of 0.060%), Dutch (46.5%, a difference of 0.080%), Czechoslovakian (46.6%, a difference of 0.080%), and Irish (46.5%, a difference of 0.10%).
| Demographics | Rating | Rank | Disability Age Over 75 |
| Immigrants | Hong Kong | 96.4 /100 | #110 | Exceptional 46.5% |
| Immigrants | Chile | 96.4 /100 | #111 | Exceptional 46.5% |
| Immigrants | Pakistan | 96.1 /100 | #112 | Exceptional 46.5% |
| Irish | 96.0 /100 | #113 | Exceptional 46.5% |
| Dutch | 95.9 /100 | #114 | Exceptional 46.5% |
| British | 95.7 /100 | #115 | Exceptional 46.5% |
| Indians (Asian) | 95.7 /100 | #116 | Exceptional 46.5% |
| Hungarians | 95.3 /100 | #117 | Exceptional 46.5% |
| Czechoslovakians | 94.7 /100 | #118 | Exceptional 46.6% |
| Canadians | 94.4 /100 | #119 | Exceptional 46.6% |
| Immigrants | Nepal | 94.1 /100 | #120 | Exceptional 46.6% |
| Scandinavians | 93.6 /100 | #121 | Exceptional 46.6% |
| Immigrants | Albania | 93.2 /100 | #122 | Exceptional 46.6% |
| Immigrants | Colombia | 92.6 /100 | #123 | Exceptional 46.7% |
| Immigrants | South America | 91.8 /100 | #124 | Exceptional 46.7% |
Demographics Similar to Okinawans by Disability Age Over 75
In terms of disability age over 75, the demographic groups most similar to Okinawans are Immigrants from Lithuania (44.9%, a difference of 0.040%), Immigrants from Austria (44.9%, a difference of 0.12%), Luxembourger (44.8%, a difference of 0.13%), Carpatho Rusyn (44.8%, a difference of 0.19%), and Paraguayan (45.0%, a difference of 0.20%).
| Demographics | Rating | Rank | Disability Age Over 75 |
| Cypriots | 100.0 /100 | #1 | Exceptional 43.5% |
| Immigrants | Ireland | 100.0 /100 | #2 | Exceptional 44.7% |
| Eastern Europeans | 100.0 /100 | #3 | Exceptional 44.8% |
| Carpatho Rusyns | 100.0 /100 | #4 | Exceptional 44.8% |
| Luxembourgers | 100.0 /100 | #5 | Exceptional 44.8% |
| Immigrants | Lithuania | 100.0 /100 | #6 | Exceptional 44.9% |
| Okinawans | 100.0 /100 | #7 | Exceptional 44.9% |
| Immigrants | Austria | 100.0 /100 | #8 | Exceptional 44.9% |
| Paraguayans | 100.0 /100 | #9 | Exceptional 45.0% |
| Bulgarians | 100.0 /100 | #10 | Exceptional 45.1% |
| Lithuanians | 100.0 /100 | #11 | Exceptional 45.1% |
| Immigrants | Czechoslovakia | 100.0 /100 | #12 | Exceptional 45.1% |
| Latvians | 100.0 /100 | #13 | Exceptional 45.1% |
| Immigrants | Scotland | 100.0 /100 | #14 | Exceptional 45.1% |
| Immigrants | Sweden | 100.0 /100 | #15 | Exceptional 45.1% |