Indonesian vs Okinawan In Labor Force | Age 35-44
COMPARE
Indonesian
Okinawan
In Labor Force | Age 35-44
In Labor Force | Age 35-44 Comparison
Indonesians
Okinawans
83.7%
IN LABOR FORCE | AGE 35-44
0.8/ 100
METRIC RATING
248th/ 347
METRIC RANK
84.5%
IN LABOR FORCE | AGE 35-44
73.5/ 100
METRIC RATING
149th/ 347
METRIC RANK
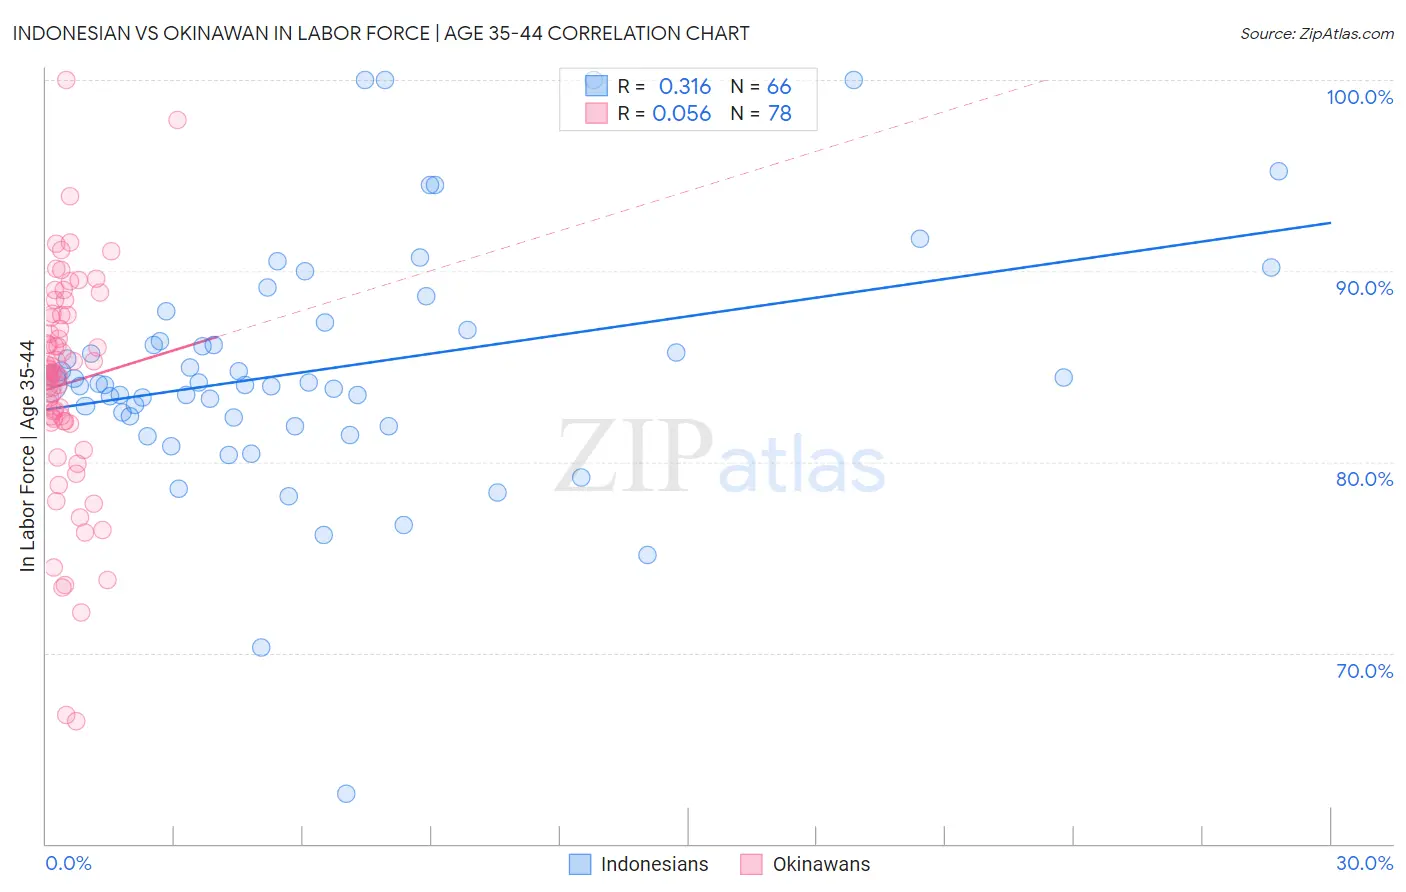
Indonesian vs Okinawan In Labor Force | Age 35-44 Correlation Chart
The statistical analysis conducted on geographies consisting of 162,640,915 people shows a mild positive correlation between the proportion of Indonesians and labor force participation rate among population between the ages 35 and 44 in the United States with a correlation coefficient (R) of 0.316 and weighted average of 83.7%. Similarly, the statistical analysis conducted on geographies consisting of 73,734,872 people shows a slight positive correlation between the proportion of Okinawans and labor force participation rate among population between the ages 35 and 44 in the United States with a correlation coefficient (R) of 0.056 and weighted average of 84.5%, a difference of 0.95%.
In Labor Force | Age 35-44 Correlation Summary
| Measurement | Indonesian | Okinawan |
| Minimum | 62.6% | 66.4% |
| Maximum | 100.0% | 100.0% |
| Range | 37.4% | 33.6% |
| Mean | 84.8% | 84.1% |
| Median | 84.1% | 84.6% |
| Interquartile 25% (IQ1) | 82.3% | 82.1% |
| Interquartile 75% (IQ3) | 86.9% | 87.7% |
| Interquartile Range (IQR) | 4.6% | 5.6% |
| Standard Deviation (Sample) | 6.4% | 5.9% |
| Standard Deviation (Population) | 6.4% | 5.9% |
Similar Demographics by In Labor Force | Age 35-44
Demographics Similar to Indonesians by In Labor Force | Age 35-44
In terms of in labor force | age 35-44, the demographic groups most similar to Indonesians are Immigrants from Armenia (83.7%, a difference of 0.020%), Immigrants (83.7%, a difference of 0.030%), Immigrants from St. Vincent and the Grenadines (83.7%, a difference of 0.030%), Immigrants from Cambodia (83.8%, a difference of 0.050%), and Immigrants from Western Asia (83.8%, a difference of 0.050%).
| Demographics | Rating | Rank | In Labor Force | Age 35-44 |
| Iraqis | 1.3 /100 | #241 | Tragic 83.8% |
| Immigrants | Cambodia | 1.1 /100 | #242 | Tragic 83.8% |
| Immigrants | Western Asia | 1.1 /100 | #243 | Tragic 83.8% |
| Guyanese | 1.1 /100 | #244 | Tragic 83.8% |
| Malaysians | 1.1 /100 | #245 | Tragic 83.8% |
| Immigrants | Immigrants | 1.0 /100 | #246 | Tragic 83.7% |
| Immigrants | Armenia | 0.9 /100 | #247 | Tragic 83.7% |
| Indonesians | 0.8 /100 | #248 | Tragic 83.7% |
| Immigrants | St. Vincent and the Grenadines | 0.7 /100 | #249 | Tragic 83.7% |
| Whites/Caucasians | 0.5 /100 | #250 | Tragic 83.6% |
| Salvadorans | 0.4 /100 | #251 | Tragic 83.6% |
| Immigrants | Guyana | 0.4 /100 | #252 | Tragic 83.6% |
| Lebanese | 0.4 /100 | #253 | Tragic 83.6% |
| Tongans | 0.4 /100 | #254 | Tragic 83.6% |
| Immigrants | Azores | 0.3 /100 | #255 | Tragic 83.6% |
Demographics Similar to Okinawans by In Labor Force | Age 35-44
In terms of in labor force | age 35-44, the demographic groups most similar to Okinawans are South American Indian (84.5%, a difference of 0.0%), Immigrants from Nigeria (84.5%, a difference of 0.0%), Romanian (84.5%, a difference of 0.010%), Immigrants from Taiwan (84.5%, a difference of 0.020%), and Immigrants from Netherlands (84.5%, a difference of 0.030%).
| Demographics | Rating | Rank | In Labor Force | Age 35-44 |
| Immigrants | Uruguay | 80.1 /100 | #142 | Excellent 84.6% |
| Immigrants | Ukraine | 79.7 /100 | #143 | Good 84.6% |
| Immigrants | Jamaica | 79.4 /100 | #144 | Good 84.6% |
| Immigrants | Saudi Arabia | 79.4 /100 | #145 | Good 84.6% |
| Immigrants | Asia | 78.7 /100 | #146 | Good 84.5% |
| Immigrants | Netherlands | 76.6 /100 | #147 | Good 84.5% |
| South American Indians | 73.6 /100 | #148 | Good 84.5% |
| Okinawans | 73.5 /100 | #149 | Good 84.5% |
| Immigrants | Nigeria | 73.3 /100 | #150 | Good 84.5% |
| Romanians | 72.1 /100 | #151 | Good 84.5% |
| Immigrants | Taiwan | 71.4 /100 | #152 | Good 84.5% |
| Trinidadians and Tobagonians | 69.5 /100 | #153 | Good 84.5% |
| Iranians | 69.4 /100 | #154 | Good 84.5% |
| Immigrants | Switzerland | 65.9 /100 | #155 | Good 84.5% |
| Immigrants | Israel | 64.3 /100 | #156 | Good 84.4% |