Immigrants from Kuwait vs Okinawan In Labor Force | Age 35-44
COMPARE
Immigrants from Kuwait
Okinawan
In Labor Force | Age 35-44
In Labor Force | Age 35-44 Comparison
Immigrants from Kuwait
Okinawans
84.8%
IN LABOR FORCE | AGE 35-44
96.7/ 100
METRIC RATING
95th/ 347
METRIC RANK
84.5%
IN LABOR FORCE | AGE 35-44
73.5/ 100
METRIC RATING
149th/ 347
METRIC RANK
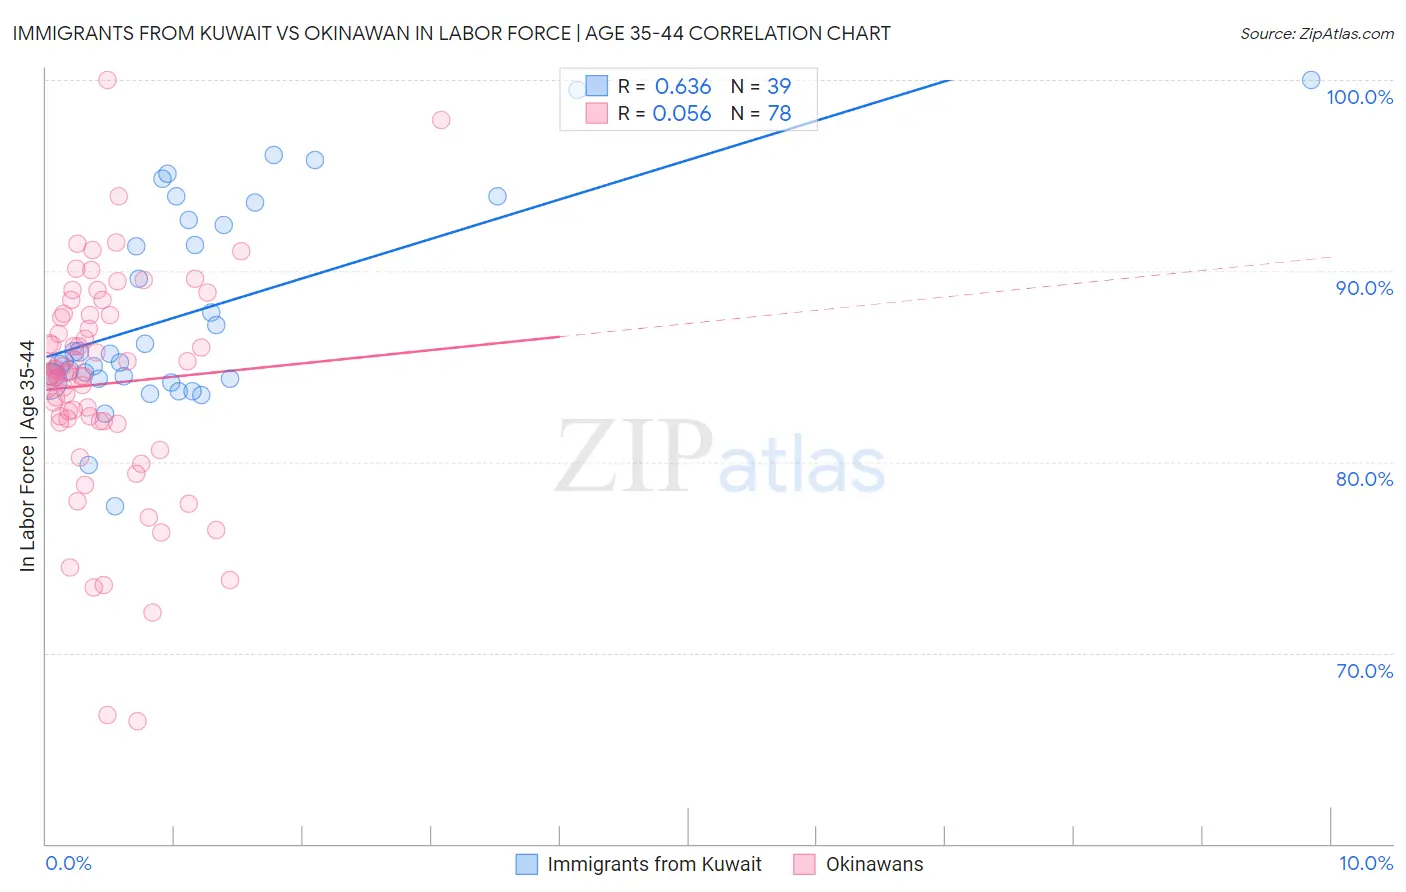
Immigrants from Kuwait vs Okinawan In Labor Force | Age 35-44 Correlation Chart
The statistical analysis conducted on geographies consisting of 136,880,462 people shows a significant positive correlation between the proportion of Immigrants from Kuwait and labor force participation rate among population between the ages 35 and 44 in the United States with a correlation coefficient (R) of 0.636 and weighted average of 84.8%. Similarly, the statistical analysis conducted on geographies consisting of 73,734,872 people shows a slight positive correlation between the proportion of Okinawans and labor force participation rate among population between the ages 35 and 44 in the United States with a correlation coefficient (R) of 0.056 and weighted average of 84.5%, a difference of 0.38%.
In Labor Force | Age 35-44 Correlation Summary
| Measurement | Immigrants from Kuwait | Okinawan |
| Minimum | 77.7% | 66.4% |
| Maximum | 100.0% | 100.0% |
| Range | 22.3% | 33.6% |
| Mean | 87.9% | 84.1% |
| Median | 85.6% | 84.6% |
| Interquartile 25% (IQ1) | 84.4% | 82.1% |
| Interquartile 75% (IQ3) | 92.7% | 87.7% |
| Interquartile Range (IQR) | 8.3% | 5.6% |
| Standard Deviation (Sample) | 5.4% | 5.9% |
| Standard Deviation (Population) | 5.3% | 5.9% |
Similar Demographics by In Labor Force | Age 35-44
Demographics Similar to Immigrants from Kuwait by In Labor Force | Age 35-44
In terms of in labor force | age 35-44, the demographic groups most similar to Immigrants from Kuwait are Cuban (84.8%, a difference of 0.0%), Egyptian (84.8%, a difference of 0.0%), Mongolian (84.8%, a difference of 0.010%), Immigrants from Northern Africa (84.8%, a difference of 0.020%), and Immigrants from Europe (84.9%, a difference of 0.030%).
| Demographics | Rating | Rank | In Labor Force | Age 35-44 |
| Yugoslavians | 97.7 /100 | #88 | Exceptional 84.9% |
| Immigrants | Pakistan | 97.5 /100 | #89 | Exceptional 84.9% |
| Immigrants | France | 97.4 /100 | #90 | Exceptional 84.9% |
| Immigrants | Europe | 97.2 /100 | #91 | Exceptional 84.9% |
| Ghanaians | 97.2 /100 | #92 | Exceptional 84.8% |
| Immigrants | Northern Africa | 97.1 /100 | #93 | Exceptional 84.8% |
| Mongolians | 96.8 /100 | #94 | Exceptional 84.8% |
| Immigrants | Kuwait | 96.7 /100 | #95 | Exceptional 84.8% |
| Cubans | 96.6 /100 | #96 | Exceptional 84.8% |
| Egyptians | 96.6 /100 | #97 | Exceptional 84.8% |
| Indians (Asian) | 96.1 /100 | #98 | Exceptional 84.8% |
| Haitians | 96.0 /100 | #99 | Exceptional 84.8% |
| Immigrants | Czechoslovakia | 95.9 /100 | #100 | Exceptional 84.8% |
| Immigrants | Australia | 95.5 /100 | #101 | Exceptional 84.8% |
| Immigrants | Southern Europe | 95.3 /100 | #102 | Exceptional 84.8% |
Demographics Similar to Okinawans by In Labor Force | Age 35-44
In terms of in labor force | age 35-44, the demographic groups most similar to Okinawans are South American Indian (84.5%, a difference of 0.0%), Immigrants from Nigeria (84.5%, a difference of 0.0%), Romanian (84.5%, a difference of 0.010%), Immigrants from Taiwan (84.5%, a difference of 0.020%), and Immigrants from Netherlands (84.5%, a difference of 0.030%).
| Demographics | Rating | Rank | In Labor Force | Age 35-44 |
| Immigrants | Uruguay | 80.1 /100 | #142 | Excellent 84.6% |
| Immigrants | Ukraine | 79.7 /100 | #143 | Good 84.6% |
| Immigrants | Jamaica | 79.4 /100 | #144 | Good 84.6% |
| Immigrants | Saudi Arabia | 79.4 /100 | #145 | Good 84.6% |
| Immigrants | Asia | 78.7 /100 | #146 | Good 84.5% |
| Immigrants | Netherlands | 76.6 /100 | #147 | Good 84.5% |
| South American Indians | 73.6 /100 | #148 | Good 84.5% |
| Okinawans | 73.5 /100 | #149 | Good 84.5% |
| Immigrants | Nigeria | 73.3 /100 | #150 | Good 84.5% |
| Romanians | 72.1 /100 | #151 | Good 84.5% |
| Immigrants | Taiwan | 71.4 /100 | #152 | Good 84.5% |
| Trinidadians and Tobagonians | 69.5 /100 | #153 | Good 84.5% |
| Iranians | 69.4 /100 | #154 | Good 84.5% |
| Immigrants | Switzerland | 65.9 /100 | #155 | Good 84.5% |
| Immigrants | Israel | 64.3 /100 | #156 | Good 84.4% |