Hungarian vs French American Indian In Labor Force | Age 35-44
COMPARE
Hungarian
French American Indian
In Labor Force | Age 35-44
In Labor Force | Age 35-44 Comparison
Hungarians
French American Indians
84.2%
IN LABOR FORCE | AGE 35-44
26.8/ 100
METRIC RATING
193rd/ 347
METRIC RANK
83.2%
IN LABOR FORCE | AGE 35-44
0.0/ 100
METRIC RATING
271st/ 347
METRIC RANK
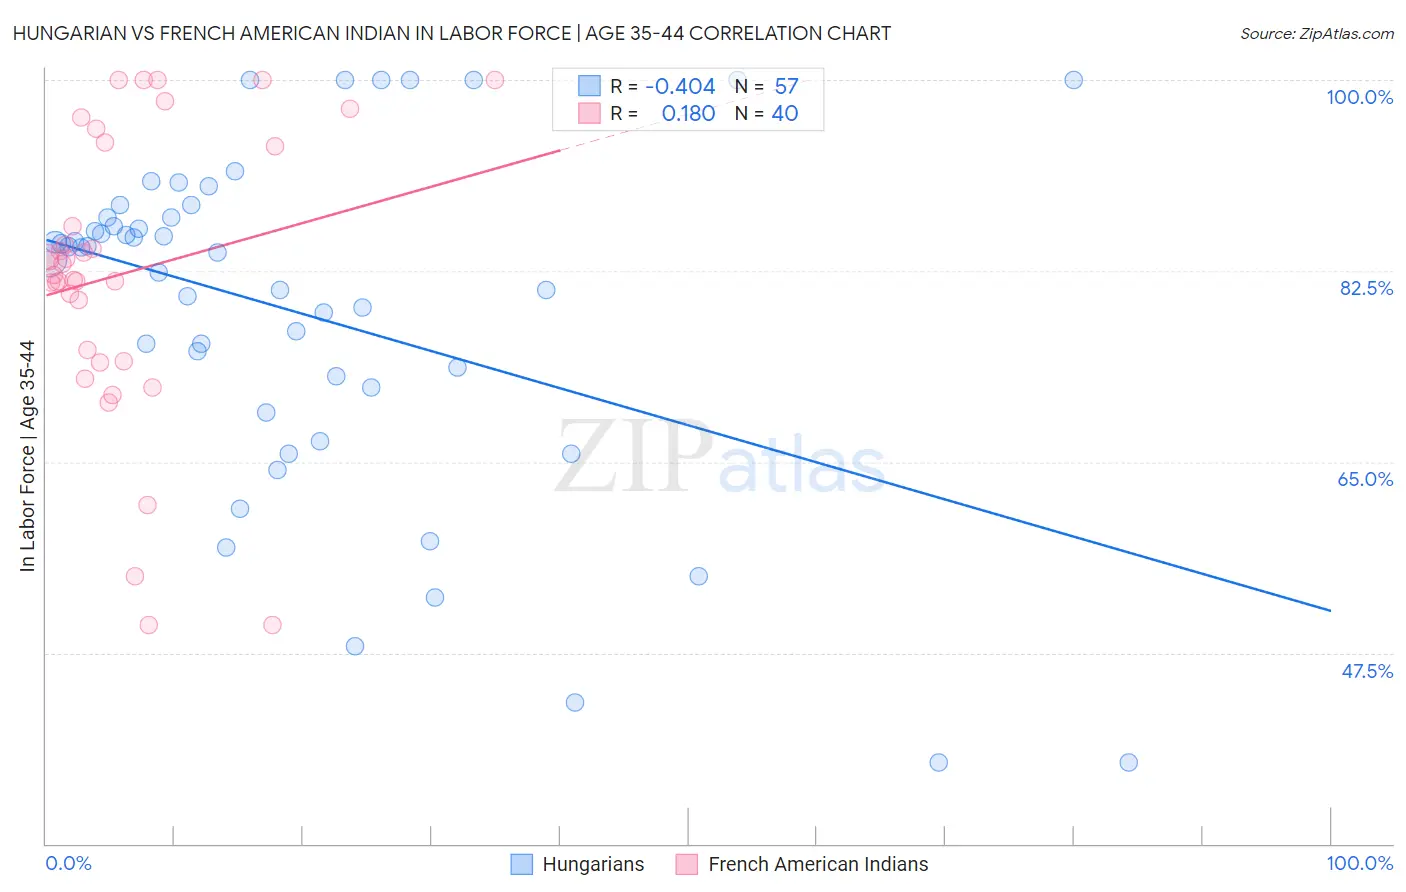
Hungarian vs French American Indian In Labor Force | Age 35-44 Correlation Chart
The statistical analysis conducted on geographies consisting of 485,922,886 people shows a moderate negative correlation between the proportion of Hungarians and labor force participation rate among population between the ages 35 and 44 in the United States with a correlation coefficient (R) of -0.404 and weighted average of 84.2%. Similarly, the statistical analysis conducted on geographies consisting of 131,970,266 people shows a poor positive correlation between the proportion of French American Indians and labor force participation rate among population between the ages 35 and 44 in the United States with a correlation coefficient (R) of 0.180 and weighted average of 83.2%, a difference of 1.2%.
In Labor Force | Age 35-44 Correlation Summary
| Measurement | Hungarian | French American Indian |
| Minimum | 37.5% | 50.0% |
| Maximum | 100.0% | 100.0% |
| Range | 62.5% | 50.0% |
| Mean | 78.6% | 82.3% |
| Median | 84.2% | 82.7% |
| Interquartile 25% (IQ1) | 70.7% | 74.7% |
| Interquartile 75% (IQ3) | 87.4% | 94.1% |
| Interquartile Range (IQR) | 16.7% | 19.3% |
| Standard Deviation (Sample) | 15.7% | 13.1% |
| Standard Deviation (Population) | 15.6% | 13.0% |
Similar Demographics by In Labor Force | Age 35-44
Demographics Similar to Hungarians by In Labor Force | Age 35-44
In terms of in labor force | age 35-44, the demographic groups most similar to Hungarians are Immigrants from Philippines (84.2%, a difference of 0.010%), Immigrants from Vietnam (84.2%, a difference of 0.010%), Immigrants from Indonesia (84.2%, a difference of 0.010%), Immigrants from Caribbean (84.2%, a difference of 0.010%), and Immigrants from England (84.2%, a difference of 0.010%).
| Demographics | Rating | Rank | In Labor Force | Age 35-44 |
| Australians | 35.1 /100 | #186 | Fair 84.3% |
| Dutch | 34.8 /100 | #187 | Fair 84.3% |
| South Africans | 34.1 /100 | #188 | Fair 84.3% |
| Immigrants | Denmark | 33.7 /100 | #189 | Fair 84.3% |
| Portuguese | 31.9 /100 | #190 | Fair 84.3% |
| Immigrants | Philippines | 27.9 /100 | #191 | Fair 84.2% |
| Immigrants | Vietnam | 27.4 /100 | #192 | Fair 84.2% |
| Hungarians | 26.8 /100 | #193 | Fair 84.2% |
| Immigrants | Indonesia | 25.7 /100 | #194 | Fair 84.2% |
| Immigrants | Caribbean | 25.7 /100 | #195 | Fair 84.2% |
| Immigrants | England | 25.0 /100 | #196 | Fair 84.2% |
| Immigrants | Western Europe | 24.7 /100 | #197 | Fair 84.2% |
| Ecuadorians | 24.0 /100 | #198 | Fair 84.2% |
| Syrians | 23.2 /100 | #199 | Fair 84.2% |
| Moroccans | 23.2 /100 | #200 | Fair 84.2% |
Demographics Similar to French American Indians by In Labor Force | Age 35-44
In terms of in labor force | age 35-44, the demographic groups most similar to French American Indians are Immigrants from Honduras (83.3%, a difference of 0.0%), Immigrants from Fiji (83.2%, a difference of 0.020%), Spanish (83.2%, a difference of 0.020%), Nonimmigrants (83.2%, a difference of 0.040%), and Hawaiian (83.2%, a difference of 0.050%).
| Demographics | Rating | Rank | In Labor Force | Age 35-44 |
| Scotch-Irish | 0.1 /100 | #264 | Tragic 83.5% |
| Central Americans | 0.1 /100 | #265 | Tragic 83.5% |
| Spaniards | 0.1 /100 | #266 | Tragic 83.4% |
| Guamanians/Chamorros | 0.1 /100 | #267 | Tragic 83.4% |
| Hondurans | 0.1 /100 | #268 | Tragic 83.4% |
| Immigrants | Grenada | 0.1 /100 | #269 | Tragic 83.3% |
| Immigrants | Honduras | 0.0 /100 | #270 | Tragic 83.3% |
| French American Indians | 0.0 /100 | #271 | Tragic 83.2% |
| Immigrants | Fiji | 0.0 /100 | #272 | Tragic 83.2% |
| Spanish | 0.0 /100 | #273 | Tragic 83.2% |
| Immigrants | Nonimmigrants | 0.0 /100 | #274 | Tragic 83.2% |
| Hawaiians | 0.0 /100 | #275 | Tragic 83.2% |
| Delaware | 0.0 /100 | #276 | Tragic 83.2% |
| Samoans | 0.0 /100 | #277 | Tragic 83.2% |
| Belizeans | 0.0 /100 | #278 | Tragic 83.1% |