Bulgarian vs Okinawan In Labor Force | Age 35-44
COMPARE
Bulgarian
Okinawan
In Labor Force | Age 35-44
In Labor Force | Age 35-44 Comparison
Bulgarians
Okinawans
85.5%
IN LABOR FORCE | AGE 35-44
100.0/ 100
METRIC RATING
21st/ 347
METRIC RANK
84.5%
IN LABOR FORCE | AGE 35-44
73.5/ 100
METRIC RATING
149th/ 347
METRIC RANK
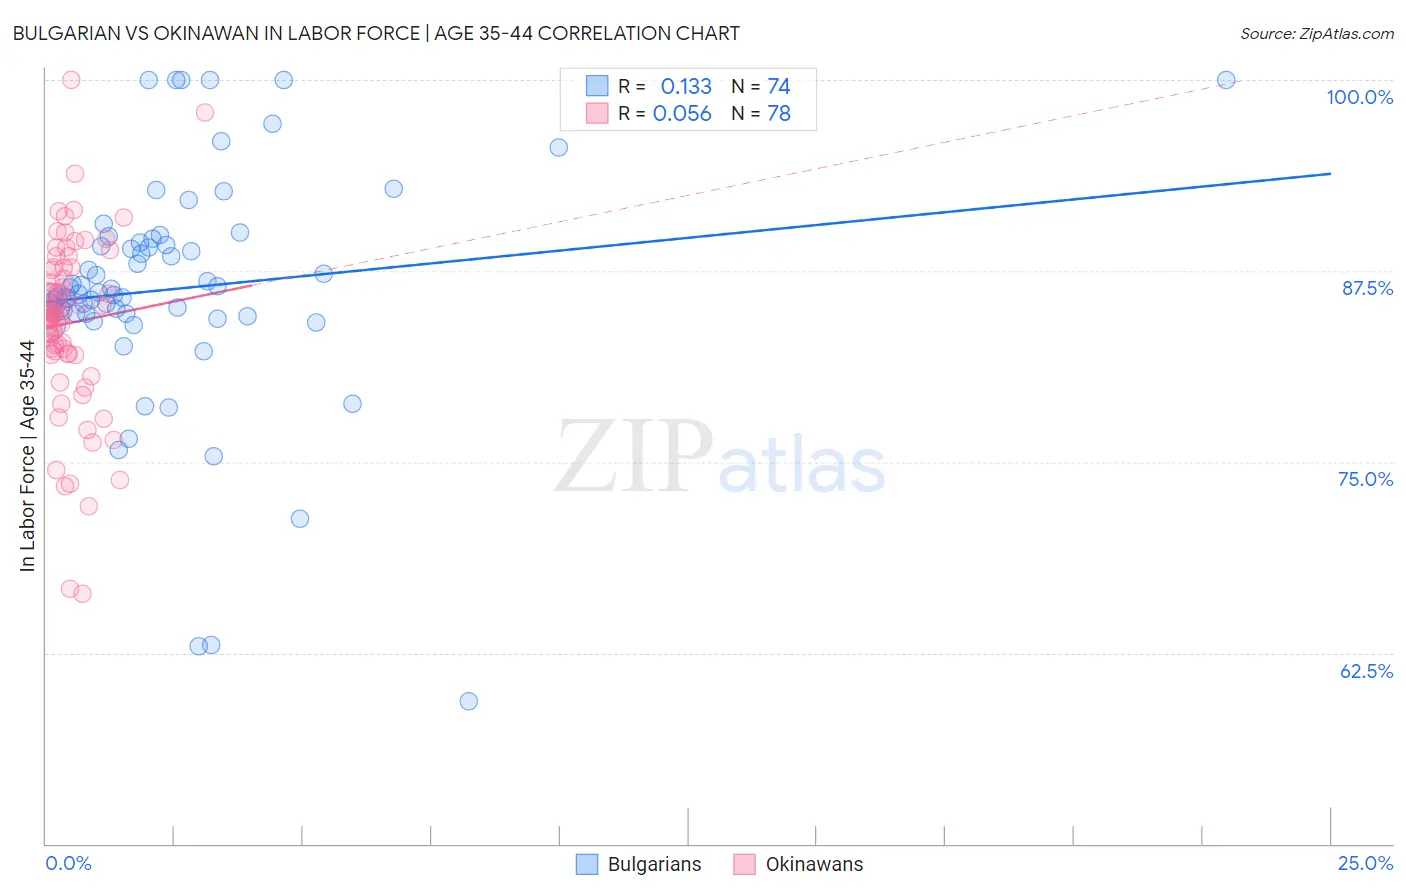
Bulgarian vs Okinawan In Labor Force | Age 35-44 Correlation Chart
The statistical analysis conducted on geographies consisting of 205,570,158 people shows a poor positive correlation between the proportion of Bulgarians and labor force participation rate among population between the ages 35 and 44 in the United States with a correlation coefficient (R) of 0.133 and weighted average of 85.5%. Similarly, the statistical analysis conducted on geographies consisting of 73,734,872 people shows a slight positive correlation between the proportion of Okinawans and labor force participation rate among population between the ages 35 and 44 in the United States with a correlation coefficient (R) of 0.056 and weighted average of 84.5%, a difference of 1.1%.
In Labor Force | Age 35-44 Correlation Summary
| Measurement | Bulgarian | Okinawan |
| Minimum | 59.3% | 66.4% |
| Maximum | 100.0% | 100.0% |
| Range | 40.7% | 33.6% |
| Mean | 86.3% | 84.1% |
| Median | 86.0% | 84.6% |
| Interquartile 25% (IQ1) | 84.7% | 82.1% |
| Interquartile 75% (IQ3) | 89.4% | 87.7% |
| Interquartile Range (IQR) | 4.7% | 5.6% |
| Standard Deviation (Sample) | 7.7% | 5.9% |
| Standard Deviation (Population) | 7.7% | 5.9% |
Similar Demographics by In Labor Force | Age 35-44
Demographics Similar to Bulgarians by In Labor Force | Age 35-44
In terms of in labor force | age 35-44, the demographic groups most similar to Bulgarians are Immigrants from Bosnia and Herzegovina (85.4%, a difference of 0.040%), Immigrants from Serbia (85.5%, a difference of 0.060%), Immigrants from Eastern Africa (85.4%, a difference of 0.060%), Carpatho Rusyn (85.6%, a difference of 0.10%), and Slovene (85.6%, a difference of 0.10%).
| Demographics | Rating | Rank | In Labor Force | Age 35-44 |
| Immigrants | Somalia | 100.0 /100 | #14 | Exceptional 85.6% |
| Norwegians | 100.0 /100 | #15 | Exceptional 85.6% |
| Immigrants | Ireland | 100.0 /100 | #16 | Exceptional 85.6% |
| Immigrants | North Macedonia | 100.0 /100 | #17 | Exceptional 85.6% |
| Carpatho Rusyns | 100.0 /100 | #18 | Exceptional 85.6% |
| Slovenes | 100.0 /100 | #19 | Exceptional 85.6% |
| Immigrants | Serbia | 100.0 /100 | #20 | Exceptional 85.5% |
| Bulgarians | 100.0 /100 | #21 | Exceptional 85.5% |
| Immigrants | Bosnia and Herzegovina | 100.0 /100 | #22 | Exceptional 85.4% |
| Immigrants | Eastern Africa | 100.0 /100 | #23 | Exceptional 85.4% |
| Latvians | 99.9 /100 | #24 | Exceptional 85.4% |
| Paraguayans | 99.9 /100 | #25 | Exceptional 85.4% |
| Immigrants | Liberia | 99.9 /100 | #26 | Exceptional 85.4% |
| Immigrants | Lithuania | 99.9 /100 | #27 | Exceptional 85.4% |
| Immigrants | Greece | 99.9 /100 | #28 | Exceptional 85.3% |
Demographics Similar to Okinawans by In Labor Force | Age 35-44
In terms of in labor force | age 35-44, the demographic groups most similar to Okinawans are South American Indian (84.5%, a difference of 0.0%), Immigrants from Nigeria (84.5%, a difference of 0.0%), Romanian (84.5%, a difference of 0.010%), Immigrants from Taiwan (84.5%, a difference of 0.020%), and Immigrants from Netherlands (84.5%, a difference of 0.030%).
| Demographics | Rating | Rank | In Labor Force | Age 35-44 |
| Immigrants | Uruguay | 80.1 /100 | #142 | Excellent 84.6% |
| Immigrants | Ukraine | 79.7 /100 | #143 | Good 84.6% |
| Immigrants | Jamaica | 79.4 /100 | #144 | Good 84.6% |
| Immigrants | Saudi Arabia | 79.4 /100 | #145 | Good 84.6% |
| Immigrants | Asia | 78.7 /100 | #146 | Good 84.5% |
| Immigrants | Netherlands | 76.6 /100 | #147 | Good 84.5% |
| South American Indians | 73.6 /100 | #148 | Good 84.5% |
| Okinawans | 73.5 /100 | #149 | Good 84.5% |
| Immigrants | Nigeria | 73.3 /100 | #150 | Good 84.5% |
| Romanians | 72.1 /100 | #151 | Good 84.5% |
| Immigrants | Taiwan | 71.4 /100 | #152 | Good 84.5% |
| Trinidadians and Tobagonians | 69.5 /100 | #153 | Good 84.5% |
| Iranians | 69.4 /100 | #154 | Good 84.5% |
| Immigrants | Switzerland | 65.9 /100 | #155 | Good 84.5% |
| Immigrants | Israel | 64.3 /100 | #156 | Good 84.4% |