Hungarian vs Okinawan Disability Age 35 to 64
COMPARE
Hungarian
Okinawan
Disability Age 35 to 64
Disability Age 35 to 64 Comparison
Hungarians
Okinawans
11.4%
DISABILITY AGE 35 TO 64
34.6/ 100
METRIC RATING
189th/ 347
METRIC RANK
9.4%
DISABILITY AGE 35 TO 64
100.0/ 100
METRIC RATING
21st/ 347
METRIC RANK
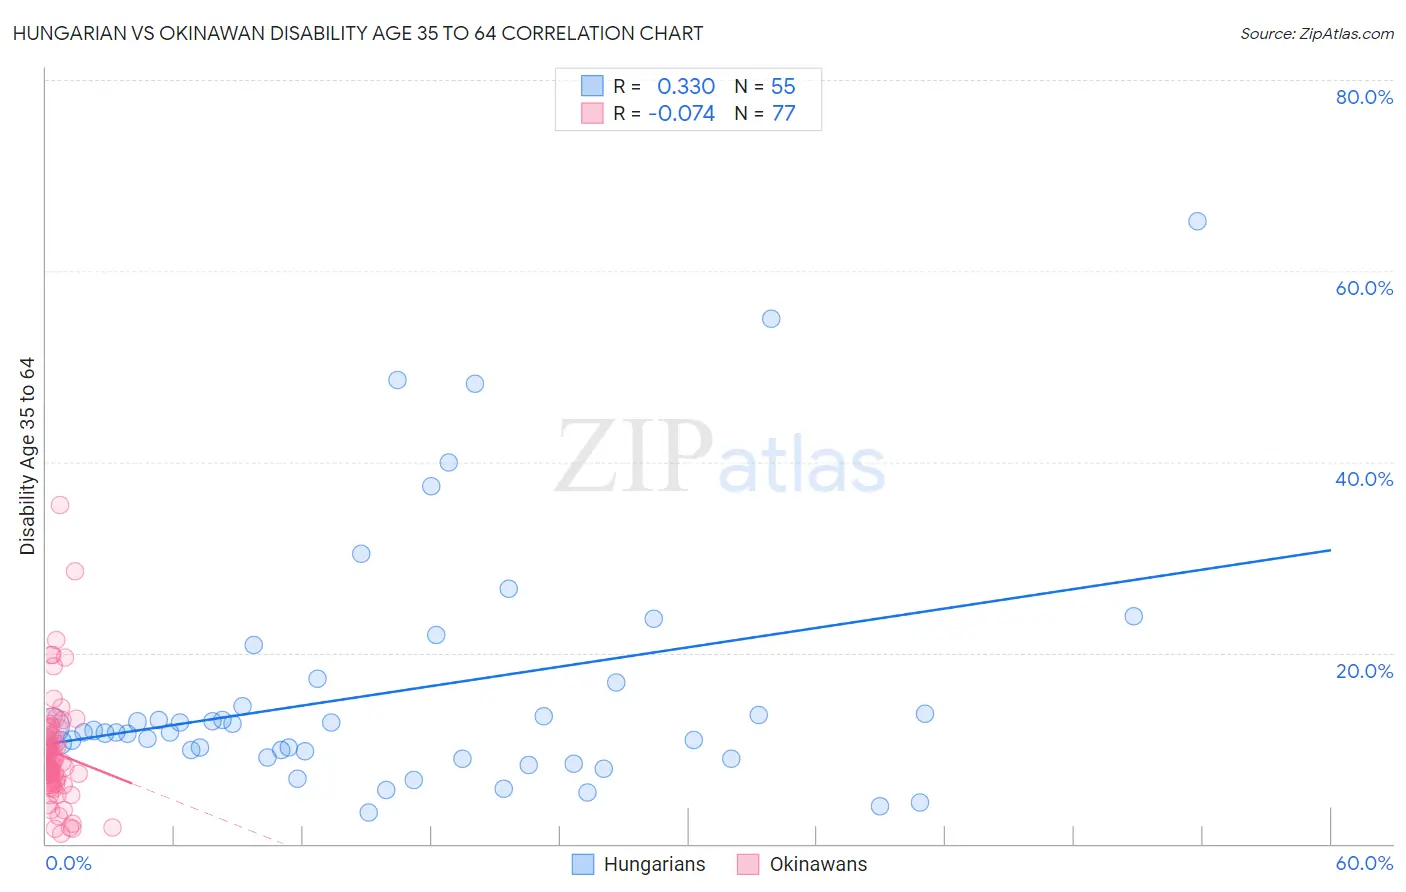
Hungarian vs Okinawan Disability Age 35 to 64 Correlation Chart
The statistical analysis conducted on geographies consisting of 485,731,393 people shows a mild positive correlation between the proportion of Hungarians and percentage of population with a disability between the ages 34 and 64 in the United States with a correlation coefficient (R) of 0.330 and weighted average of 11.4%. Similarly, the statistical analysis conducted on geographies consisting of 73,717,976 people shows a slight negative correlation between the proportion of Okinawans and percentage of population with a disability between the ages 34 and 64 in the United States with a correlation coefficient (R) of -0.074 and weighted average of 9.4%, a difference of 22.0%.
Disability Age 35 to 64 Correlation Summary
| Measurement | Hungarian | Okinawan |
| Minimum | 3.3% | 1.1% |
| Maximum | 65.2% | 35.5% |
| Range | 61.9% | 34.4% |
| Mean | 16.1% | 9.5% |
| Median | 11.7% | 8.4% |
| Interquartile 25% (IQ1) | 9.0% | 6.4% |
| Interquartile 75% (IQ3) | 16.9% | 11.3% |
| Interquartile Range (IQR) | 7.9% | 4.9% |
| Standard Deviation (Sample) | 13.2% | 5.7% |
| Standard Deviation (Population) | 13.0% | 5.7% |
Similar Demographics by Disability Age 35 to 64
Demographics Similar to Hungarians by Disability Age 35 to 64
In terms of disability age 35 to 64, the demographic groups most similar to Hungarians are Northern European (11.4%, a difference of 0.020%), Immigrants from Bosnia and Herzegovina (11.4%, a difference of 0.050%), Slovene (11.4%, a difference of 0.17%), Danish (11.4%, a difference of 0.19%), and Immigrants from Nigeria (11.4%, a difference of 0.19%).
| Demographics | Rating | Rank | Disability Age 35 to 64 |
| Icelanders | 39.7 /100 | #182 | Fair 11.4% |
| Immigrants | Oceania | 39.5 /100 | #183 | Fair 11.4% |
| Kenyans | 39.2 /100 | #184 | Fair 11.4% |
| Danes | 36.8 /100 | #185 | Fair 11.4% |
| Slovenes | 36.6 /100 | #186 | Fair 11.4% |
| Immigrants | Bosnia and Herzegovina | 35.2 /100 | #187 | Fair 11.4% |
| Northern Europeans | 34.9 /100 | #188 | Fair 11.4% |
| Hungarians | 34.6 /100 | #189 | Fair 11.4% |
| Immigrants | Nigeria | 32.5 /100 | #190 | Fair 11.4% |
| Swedes | 31.3 /100 | #191 | Fair 11.4% |
| Norwegians | 29.7 /100 | #192 | Fair 11.5% |
| Immigrants | Africa | 29.0 /100 | #193 | Fair 11.5% |
| Immigrants | Latin America | 27.5 /100 | #194 | Fair 11.5% |
| Carpatho Rusyns | 25.3 /100 | #195 | Fair 11.5% |
| Iraqis | 24.2 /100 | #196 | Fair 11.5% |
Demographics Similar to Okinawans by Disability Age 35 to 64
In terms of disability age 35 to 64, the demographic groups most similar to Okinawans are Cypriot (9.4%, a difference of 0.030%), Argentinean (9.4%, a difference of 0.25%), Asian (9.4%, a difference of 0.26%), Immigrants from Argentina (9.3%, a difference of 0.43%), and Venezuelan (9.4%, a difference of 0.56%).
| Demographics | Rating | Rank | Disability Age 35 to 64 |
| Immigrants | Singapore | 100.0 /100 | #14 | Exceptional 8.9% |
| Bolivians | 100.0 /100 | #15 | Exceptional 8.9% |
| Immigrants | Korea | 100.0 /100 | #16 | Exceptional 9.0% |
| Burmese | 100.0 /100 | #17 | Exceptional 9.2% |
| Soviet Union | 100.0 /100 | #18 | Exceptional 9.2% |
| Immigrants | Venezuela | 100.0 /100 | #19 | Exceptional 9.3% |
| Immigrants | Argentina | 100.0 /100 | #20 | Exceptional 9.3% |
| Okinawans | 100.0 /100 | #21 | Exceptional 9.4% |
| Cypriots | 100.0 /100 | #22 | Exceptional 9.4% |
| Argentineans | 100.0 /100 | #23 | Exceptional 9.4% |
| Asians | 100.0 /100 | #24 | Exceptional 9.4% |
| Venezuelans | 100.0 /100 | #25 | Exceptional 9.4% |
| Immigrants | Sri Lanka | 100.0 /100 | #26 | Exceptional 9.5% |
| Immigrants | Asia | 100.0 /100 | #27 | Exceptional 9.5% |
| Immigrants | Pakistan | 100.0 /100 | #28 | Exceptional 9.5% |