Hmong vs Yaqui In Labor Force | Age 25-29
COMPARE
Hmong
Yaqui
In Labor Force | Age 25-29
In Labor Force | Age 25-29 Comparison
Hmong
Yaqui
83.7%
IN LABOR FORCE | AGE 25-29
0.3/ 100
METRIC RATING
249th/ 347
METRIC RANK
82.2%
IN LABOR FORCE | AGE 25-29
0.0/ 100
METRIC RATING
313th/ 347
METRIC RANK
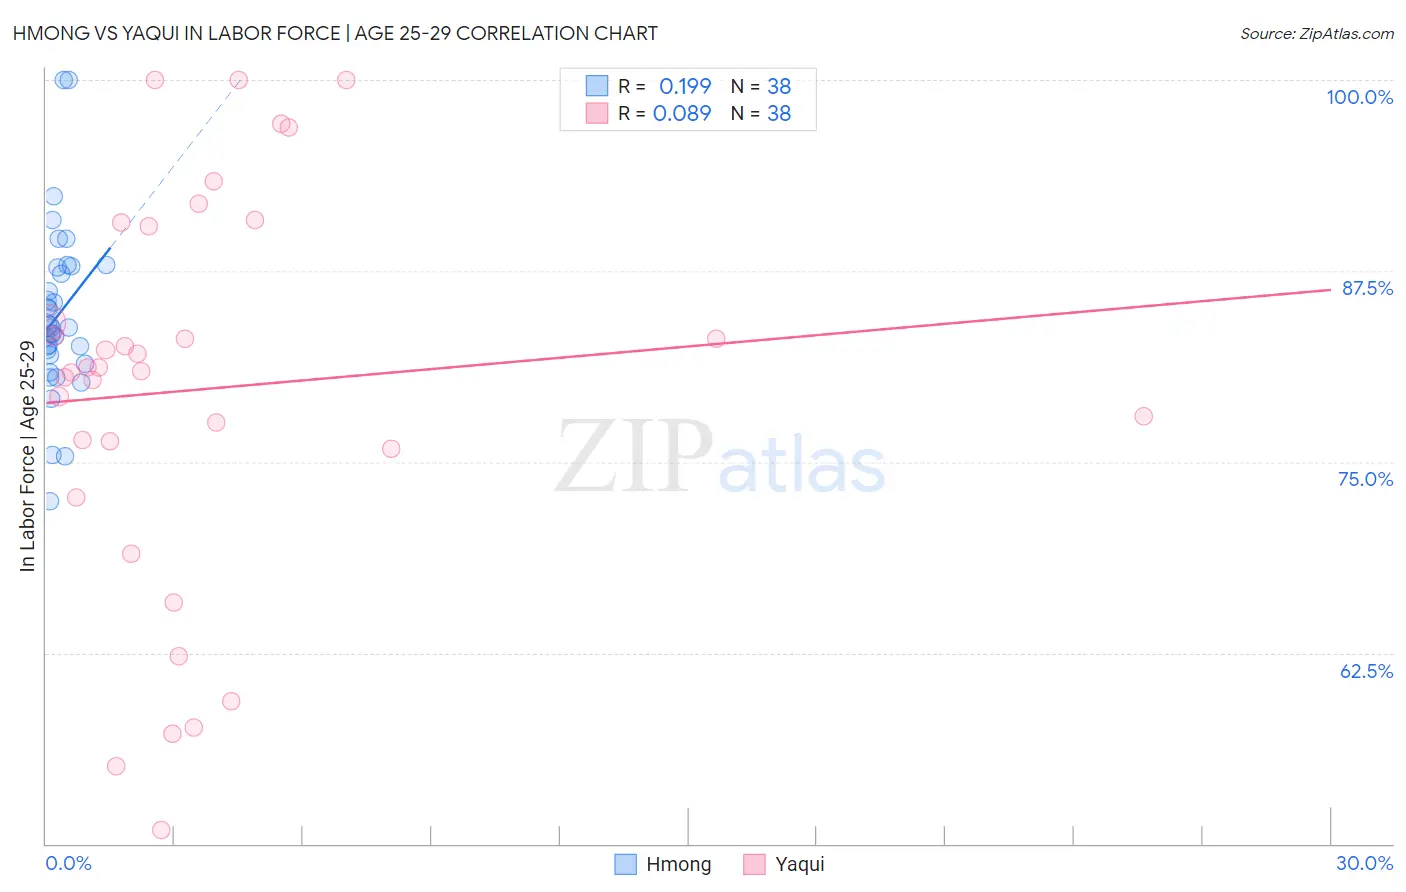
Hmong vs Yaqui In Labor Force | Age 25-29 Correlation Chart
The statistical analysis conducted on geographies consisting of 24,664,732 people shows a poor positive correlation between the proportion of Hmong and labor force participation rate among population between the ages 25 and 29 in the United States with a correlation coefficient (R) of 0.199 and weighted average of 83.7%. Similarly, the statistical analysis conducted on geographies consisting of 107,713,986 people shows a slight positive correlation between the proportion of Yaqui and labor force participation rate among population between the ages 25 and 29 in the United States with a correlation coefficient (R) of 0.089 and weighted average of 82.2%, a difference of 1.9%.
In Labor Force | Age 25-29 Correlation Summary
| Measurement | Hmong | Yaqui |
| Minimum | 72.4% | 50.9% |
| Maximum | 100.0% | 100.0% |
| Range | 27.6% | 49.1% |
| Mean | 84.6% | 79.7% |
| Median | 83.8% | 81.1% |
| Interquartile 25% (IQ1) | 82.0% | 75.9% |
| Interquartile 75% (IQ3) | 87.7% | 90.5% |
| Interquartile Range (IQR) | 5.7% | 14.6% |
| Standard Deviation (Sample) | 5.5% | 12.9% |
| Standard Deviation (Population) | 5.5% | 12.7% |
Similar Demographics by In Labor Force | Age 25-29
Demographics Similar to Hmong by In Labor Force | Age 25-29
In terms of in labor force | age 25-29, the demographic groups most similar to Hmong are Nonimmigrants (83.7%, a difference of 0.010%), Central American (83.7%, a difference of 0.020%), Immigrants from El Salvador (83.7%, a difference of 0.030%), Bahamian (83.7%, a difference of 0.030%), and Cree (83.8%, a difference of 0.040%).
| Demographics | Rating | Rank | In Labor Force | Age 25-29 |
| U.S. Virgin Islanders | 0.6 /100 | #242 | Tragic 83.8% |
| Salvadorans | 0.5 /100 | #243 | Tragic 83.8% |
| Immigrants | Jamaica | 0.4 /100 | #244 | Tragic 83.8% |
| Iroquois | 0.4 /100 | #245 | Tragic 83.8% |
| Cree | 0.3 /100 | #246 | Tragic 83.8% |
| Immigrants | El Salvador | 0.3 /100 | #247 | Tragic 83.7% |
| Immigrants | Nonimmigrants | 0.3 /100 | #248 | Tragic 83.7% |
| Hmong | 0.3 /100 | #249 | Tragic 83.7% |
| Central Americans | 0.2 /100 | #250 | Tragic 83.7% |
| Bahamians | 0.2 /100 | #251 | Tragic 83.7% |
| Guatemalans | 0.2 /100 | #252 | Tragic 83.7% |
| Immigrants | Trinidad and Tobago | 0.2 /100 | #253 | Tragic 83.7% |
| Spaniards | 0.2 /100 | #254 | Tragic 83.7% |
| Haitians | 0.2 /100 | #255 | Tragic 83.7% |
| Immigrants | Haiti | 0.2 /100 | #256 | Tragic 83.7% |
Demographics Similar to Yaqui by In Labor Force | Age 25-29
In terms of in labor force | age 25-29, the demographic groups most similar to Yaqui are Cherokee (82.1%, a difference of 0.050%), Hispanic or Latino (82.2%, a difference of 0.10%), Osage (82.3%, a difference of 0.17%), Alaskan Athabascan (82.3%, a difference of 0.17%), and Immigrants from Mexico (82.0%, a difference of 0.18%).
| Demographics | Rating | Rank | In Labor Force | Age 25-29 |
| Blackfeet | 0.0 /100 | #306 | Tragic 82.6% |
| Cajuns | 0.0 /100 | #307 | Tragic 82.5% |
| Central American Indians | 0.0 /100 | #308 | Tragic 82.4% |
| Immigrants | Central America | 0.0 /100 | #309 | Tragic 82.4% |
| Osage | 0.0 /100 | #310 | Tragic 82.3% |
| Alaskan Athabascans | 0.0 /100 | #311 | Tragic 82.3% |
| Hispanics or Latinos | 0.0 /100 | #312 | Tragic 82.2% |
| Yaqui | 0.0 /100 | #313 | Tragic 82.2% |
| Cherokee | 0.0 /100 | #314 | Tragic 82.1% |
| Immigrants | Mexico | 0.0 /100 | #315 | Tragic 82.0% |
| Mexicans | 0.0 /100 | #316 | Tragic 81.9% |
| Chickasaw | 0.0 /100 | #317 | Tragic 81.9% |
| Comanche | 0.0 /100 | #318 | Tragic 81.9% |
| Seminole | 0.0 /100 | #319 | Tragic 81.7% |
| Colville | 0.0 /100 | #320 | Tragic 81.6% |