Paraguayan vs Yaqui In Labor Force | Age 25-29
COMPARE
Paraguayan
Yaqui
In Labor Force | Age 25-29
In Labor Force | Age 25-29 Comparison
Paraguayans
Yaqui
85.9%
IN LABOR FORCE | AGE 25-29
100.0/ 100
METRIC RATING
27th/ 347
METRIC RANK
82.2%
IN LABOR FORCE | AGE 25-29
0.0/ 100
METRIC RATING
313th/ 347
METRIC RANK
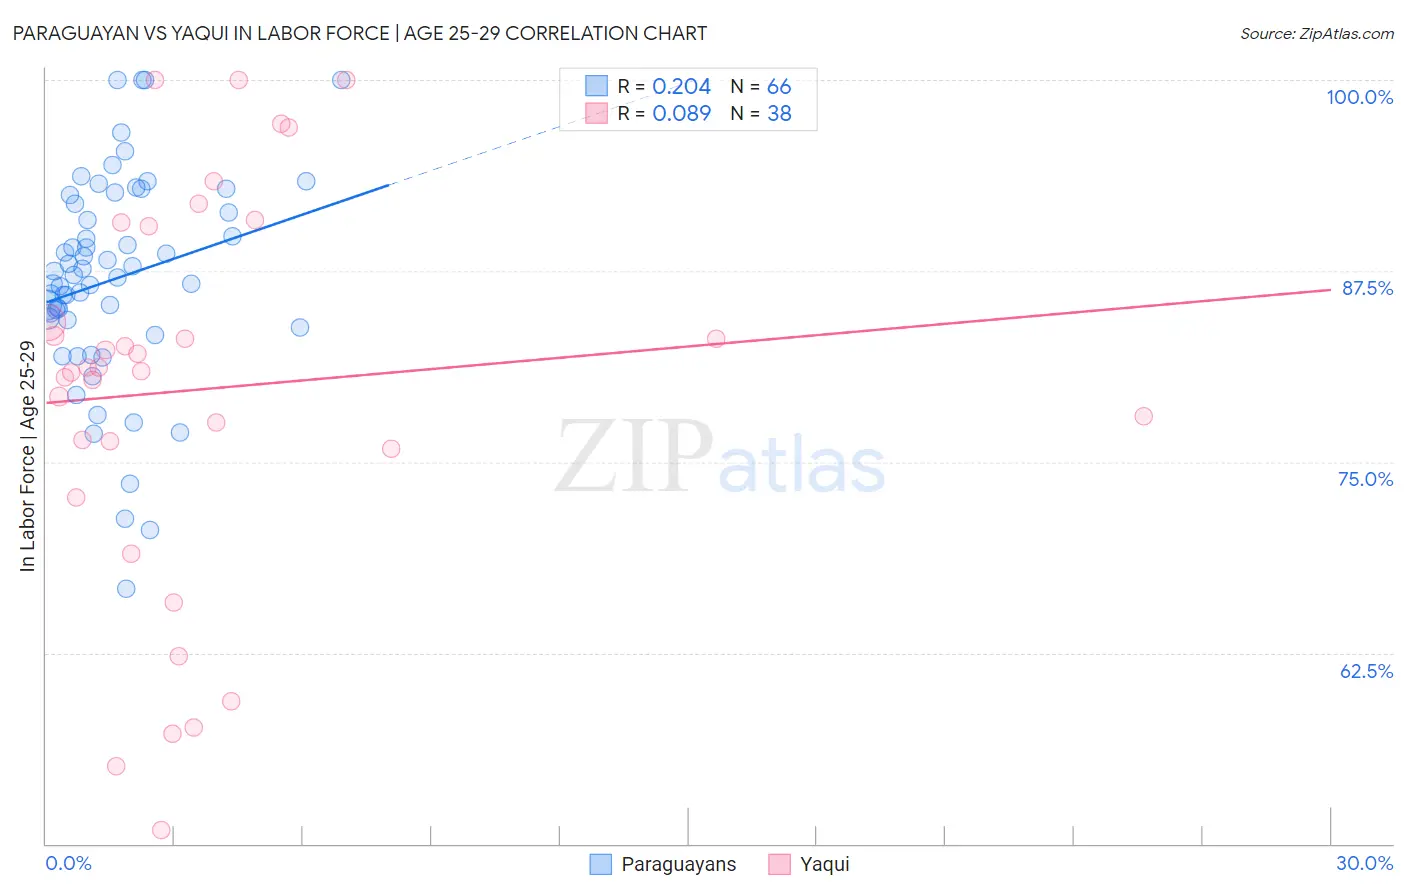
Paraguayan vs Yaqui In Labor Force | Age 25-29 Correlation Chart
The statistical analysis conducted on geographies consisting of 95,105,019 people shows a weak positive correlation between the proportion of Paraguayans and labor force participation rate among population between the ages 25 and 29 in the United States with a correlation coefficient (R) of 0.204 and weighted average of 85.9%. Similarly, the statistical analysis conducted on geographies consisting of 107,713,986 people shows a slight positive correlation between the proportion of Yaqui and labor force participation rate among population between the ages 25 and 29 in the United States with a correlation coefficient (R) of 0.089 and weighted average of 82.2%, a difference of 4.5%.
In Labor Force | Age 25-29 Correlation Summary
| Measurement | Paraguayan | Yaqui |
| Minimum | 66.7% | 50.9% |
| Maximum | 100.0% | 100.0% |
| Range | 33.3% | 49.1% |
| Mean | 87.0% | 79.7% |
| Median | 87.2% | 81.1% |
| Interquartile 25% (IQ1) | 84.3% | 75.9% |
| Interquartile 75% (IQ3) | 91.9% | 90.5% |
| Interquartile Range (IQR) | 7.6% | 14.6% |
| Standard Deviation (Sample) | 6.9% | 12.9% |
| Standard Deviation (Population) | 6.8% | 12.7% |
Similar Demographics by In Labor Force | Age 25-29
Demographics Similar to Paraguayans by In Labor Force | Age 25-29
In terms of in labor force | age 25-29, the demographic groups most similar to Paraguayans are Immigrants from North Macedonia (85.9%, a difference of 0.010%), Ugandan (85.9%, a difference of 0.010%), Immigrants from Liberia (85.9%, a difference of 0.010%), Immigrants from Serbia (85.9%, a difference of 0.050%), and German Russian (85.8%, a difference of 0.060%).
| Demographics | Rating | Rank | In Labor Force | Age 25-29 |
| Immigrants | Ireland | 100.0 /100 | #20 | Exceptional 86.0% |
| Maltese | 100.0 /100 | #21 | Exceptional 86.0% |
| Cambodians | 100.0 /100 | #22 | Exceptional 86.0% |
| Immigrants | Uganda | 100.0 /100 | #23 | Exceptional 86.0% |
| Immigrants | Eastern Africa | 100.0 /100 | #24 | Exceptional 86.0% |
| Sudanese | 100.0 /100 | #25 | Exceptional 85.9% |
| Immigrants | North Macedonia | 100.0 /100 | #26 | Exceptional 85.9% |
| Paraguayans | 100.0 /100 | #27 | Exceptional 85.9% |
| Ugandans | 100.0 /100 | #28 | Exceptional 85.9% |
| Immigrants | Liberia | 100.0 /100 | #29 | Exceptional 85.9% |
| Immigrants | Serbia | 100.0 /100 | #30 | Exceptional 85.9% |
| German Russians | 100.0 /100 | #31 | Exceptional 85.8% |
| Slovaks | 100.0 /100 | #32 | Exceptional 85.8% |
| Immigrants | Bulgaria | 100.0 /100 | #33 | Exceptional 85.8% |
| Lithuanians | 99.9 /100 | #34 | Exceptional 85.8% |
Demographics Similar to Yaqui by In Labor Force | Age 25-29
In terms of in labor force | age 25-29, the demographic groups most similar to Yaqui are Cherokee (82.1%, a difference of 0.050%), Hispanic or Latino (82.2%, a difference of 0.10%), Osage (82.3%, a difference of 0.17%), Alaskan Athabascan (82.3%, a difference of 0.17%), and Immigrants from Mexico (82.0%, a difference of 0.18%).
| Demographics | Rating | Rank | In Labor Force | Age 25-29 |
| Blackfeet | 0.0 /100 | #306 | Tragic 82.6% |
| Cajuns | 0.0 /100 | #307 | Tragic 82.5% |
| Central American Indians | 0.0 /100 | #308 | Tragic 82.4% |
| Immigrants | Central America | 0.0 /100 | #309 | Tragic 82.4% |
| Osage | 0.0 /100 | #310 | Tragic 82.3% |
| Alaskan Athabascans | 0.0 /100 | #311 | Tragic 82.3% |
| Hispanics or Latinos | 0.0 /100 | #312 | Tragic 82.2% |
| Yaqui | 0.0 /100 | #313 | Tragic 82.2% |
| Cherokee | 0.0 /100 | #314 | Tragic 82.1% |
| Immigrants | Mexico | 0.0 /100 | #315 | Tragic 82.0% |
| Mexicans | 0.0 /100 | #316 | Tragic 81.9% |
| Chickasaw | 0.0 /100 | #317 | Tragic 81.9% |
| Comanche | 0.0 /100 | #318 | Tragic 81.9% |
| Seminole | 0.0 /100 | #319 | Tragic 81.7% |
| Colville | 0.0 /100 | #320 | Tragic 81.6% |