Hmong vs Immigrants from Korea In Labor Force | Age 25-29
COMPARE
Hmong
Immigrants from Korea
In Labor Force | Age 25-29
In Labor Force | Age 25-29 Comparison
Hmong
Immigrants from Korea
83.7%
IN LABOR FORCE | AGE 25-29
0.3/ 100
METRIC RATING
249th/ 347
METRIC RANK
85.1%
IN LABOR FORCE | AGE 25-29
94.8/ 100
METRIC RATING
94th/ 347
METRIC RANK
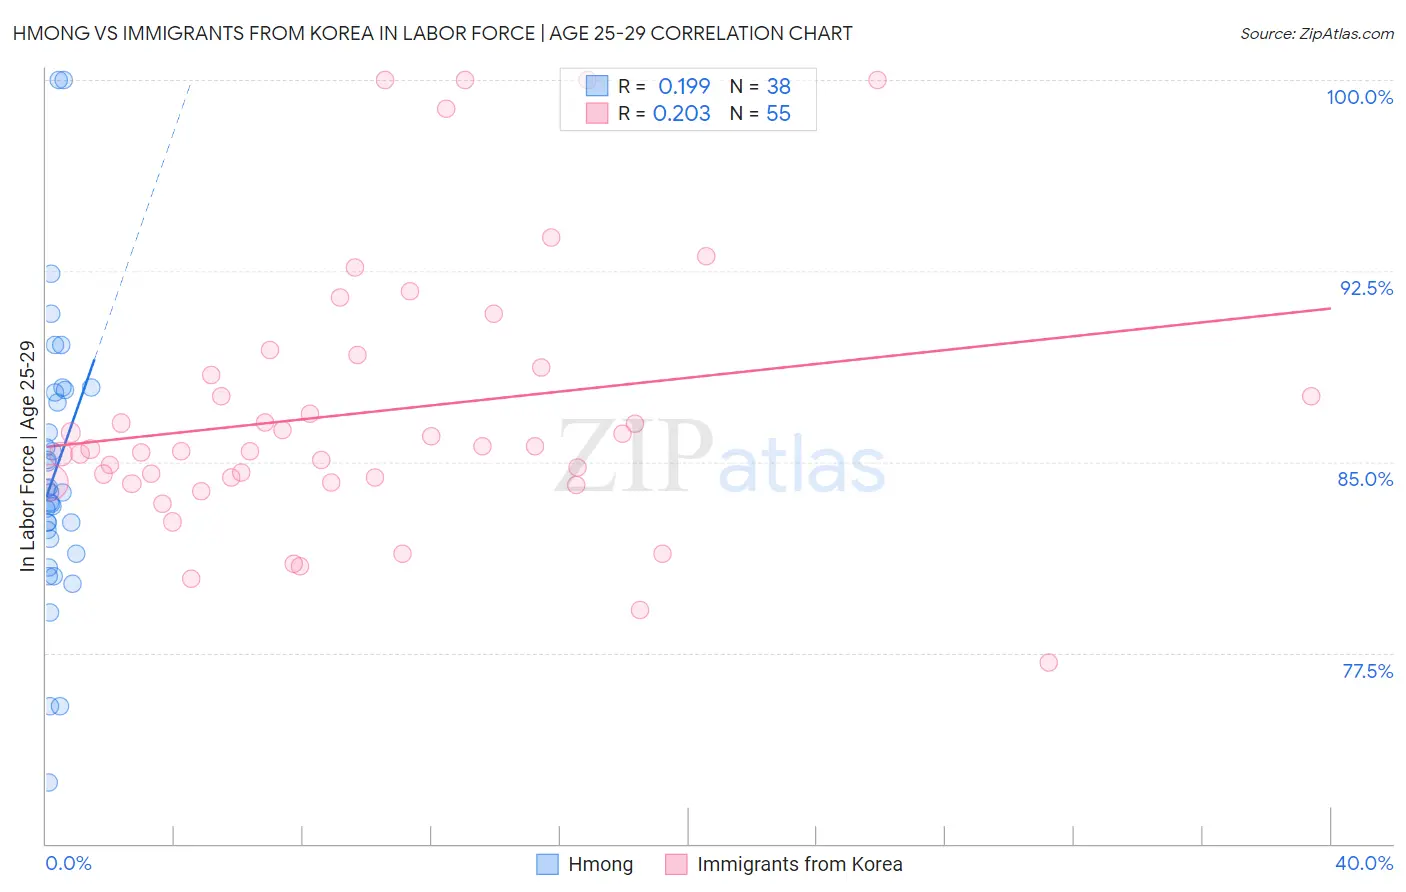
Hmong vs Immigrants from Korea In Labor Force | Age 25-29 Correlation Chart
The statistical analysis conducted on geographies consisting of 24,664,732 people shows a poor positive correlation between the proportion of Hmong and labor force participation rate among population between the ages 25 and 29 in the United States with a correlation coefficient (R) of 0.199 and weighted average of 83.7%. Similarly, the statistical analysis conducted on geographies consisting of 416,167,455 people shows a weak positive correlation between the proportion of Immigrants from Korea and labor force participation rate among population between the ages 25 and 29 in the United States with a correlation coefficient (R) of 0.203 and weighted average of 85.1%, a difference of 1.7%.
In Labor Force | Age 25-29 Correlation Summary
| Measurement | Hmong | Immigrants from Korea |
| Minimum | 72.4% | 77.1% |
| Maximum | 100.0% | 100.0% |
| Range | 27.6% | 22.9% |
| Mean | 84.6% | 87.0% |
| Median | 83.8% | 85.5% |
| Interquartile 25% (IQ1) | 82.0% | 84.2% |
| Interquartile 75% (IQ3) | 87.7% | 88.7% |
| Interquartile Range (IQR) | 5.7% | 4.5% |
| Standard Deviation (Sample) | 5.5% | 5.2% |
| Standard Deviation (Population) | 5.5% | 5.2% |
Similar Demographics by In Labor Force | Age 25-29
Demographics Similar to Hmong by In Labor Force | Age 25-29
In terms of in labor force | age 25-29, the demographic groups most similar to Hmong are Nonimmigrants (83.7%, a difference of 0.010%), Central American (83.7%, a difference of 0.020%), Immigrants from El Salvador (83.7%, a difference of 0.030%), Bahamian (83.7%, a difference of 0.030%), and Cree (83.8%, a difference of 0.040%).
| Demographics | Rating | Rank | In Labor Force | Age 25-29 |
| U.S. Virgin Islanders | 0.6 /100 | #242 | Tragic 83.8% |
| Salvadorans | 0.5 /100 | #243 | Tragic 83.8% |
| Immigrants | Jamaica | 0.4 /100 | #244 | Tragic 83.8% |
| Iroquois | 0.4 /100 | #245 | Tragic 83.8% |
| Cree | 0.3 /100 | #246 | Tragic 83.8% |
| Immigrants | El Salvador | 0.3 /100 | #247 | Tragic 83.7% |
| Immigrants | Nonimmigrants | 0.3 /100 | #248 | Tragic 83.7% |
| Hmong | 0.3 /100 | #249 | Tragic 83.7% |
| Central Americans | 0.2 /100 | #250 | Tragic 83.7% |
| Bahamians | 0.2 /100 | #251 | Tragic 83.7% |
| Guatemalans | 0.2 /100 | #252 | Tragic 83.7% |
| Immigrants | Trinidad and Tobago | 0.2 /100 | #253 | Tragic 83.7% |
| Spaniards | 0.2 /100 | #254 | Tragic 83.7% |
| Haitians | 0.2 /100 | #255 | Tragic 83.7% |
| Immigrants | Haiti | 0.2 /100 | #256 | Tragic 83.7% |
Demographics Similar to Immigrants from Korea by In Labor Force | Age 25-29
In terms of in labor force | age 25-29, the demographic groups most similar to Immigrants from Korea are Immigrants from Netherlands (85.1%, a difference of 0.010%), Immigrants from Romania (85.1%, a difference of 0.010%), Austrian (85.1%, a difference of 0.020%), Immigrants from Sudan (85.1%, a difference of 0.020%), and Immigrants from Costa Rica (85.1%, a difference of 0.030%).
| Demographics | Rating | Rank | In Labor Force | Age 25-29 |
| French Canadians | 96.5 /100 | #87 | Exceptional 85.2% |
| Immigrants | Croatia | 96.4 /100 | #88 | Exceptional 85.2% |
| Immigrants | France | 96.3 /100 | #89 | Exceptional 85.2% |
| Burmese | 95.9 /100 | #90 | Exceptional 85.1% |
| Immigrants | Moldova | 95.8 /100 | #91 | Exceptional 85.1% |
| Immigrants | Costa Rica | 95.5 /100 | #92 | Exceptional 85.1% |
| Austrians | 95.3 /100 | #93 | Exceptional 85.1% |
| Immigrants | Korea | 94.8 /100 | #94 | Exceptional 85.1% |
| Immigrants | Netherlands | 94.6 /100 | #95 | Exceptional 85.1% |
| Immigrants | Romania | 94.6 /100 | #96 | Exceptional 85.1% |
| Immigrants | Sudan | 94.3 /100 | #97 | Exceptional 85.1% |
| Mongolians | 94.1 /100 | #98 | Exceptional 85.1% |
| Bangladeshis | 94.0 /100 | #99 | Exceptional 85.1% |
| Immigrants | Switzerland | 93.9 /100 | #100 | Exceptional 85.1% |
| Egyptians | 93.8 /100 | #101 | Exceptional 85.1% |