Hmong vs Yaqui Female Poverty Among 25-34 Year Olds
COMPARE
Hmong
Yaqui
Female Poverty Among 25-34 Year Olds
Female Poverty Among 25-34 Year Olds Comparison
Hmong
Yaqui
13.9%
FEMALE POVERTY AMONG 25-34 YEAR OLDS
20.3/ 100
METRIC RATING
200th/ 347
METRIC RANK
17.0%
FEMALE POVERTY AMONG 25-34 YEAR OLDS
0.0/ 100
METRIC RATING
307th/ 347
METRIC RANK
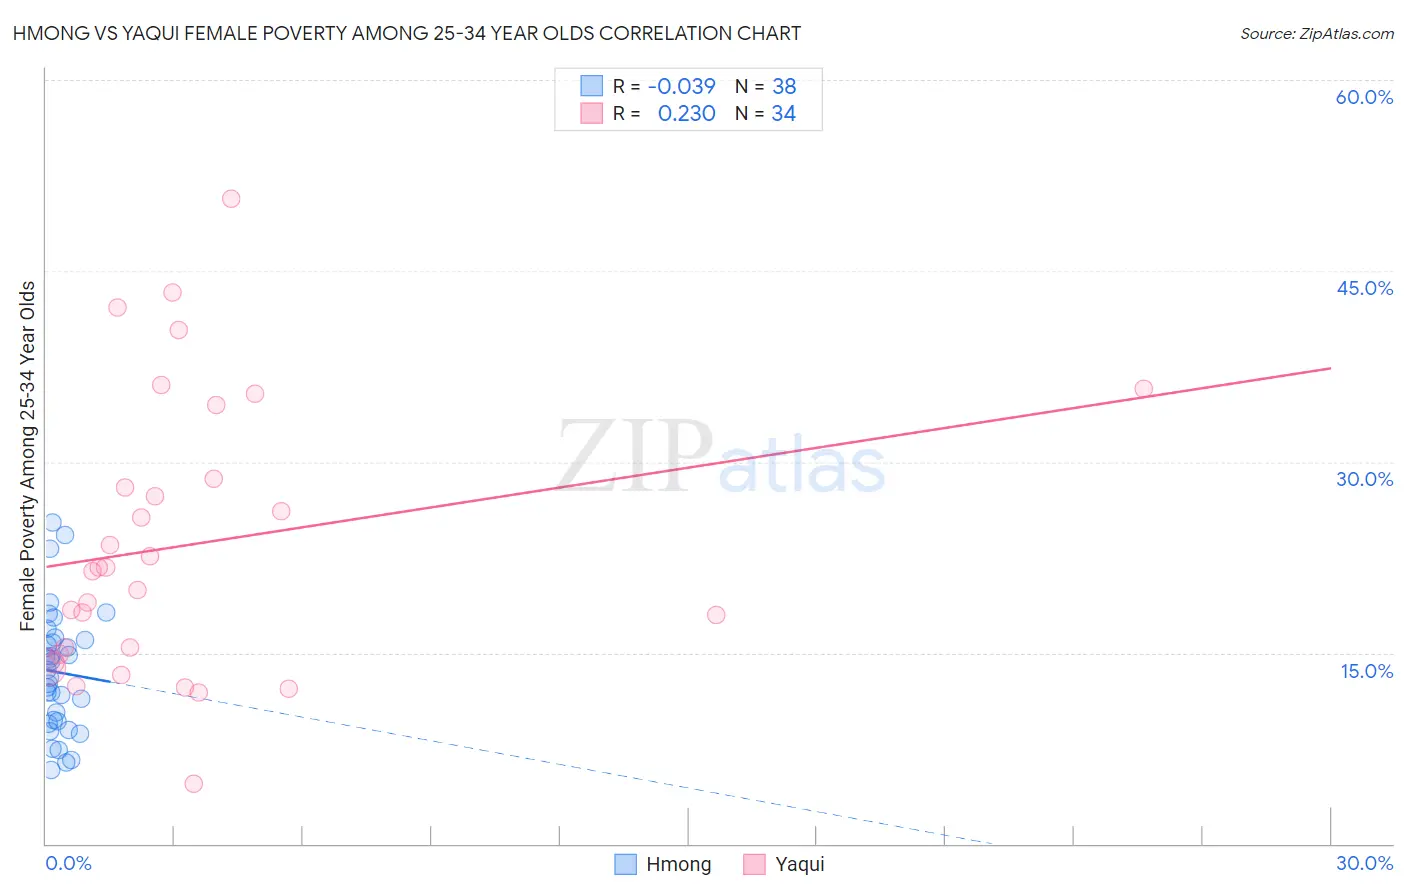
Hmong vs Yaqui Female Poverty Among 25-34 Year Olds Correlation Chart
The statistical analysis conducted on geographies consisting of 24,665,779 people shows no correlation between the proportion of Hmong and poverty level among females between the ages 25 and 34 in the United States with a correlation coefficient (R) of -0.039 and weighted average of 13.9%. Similarly, the statistical analysis conducted on geographies consisting of 107,367,613 people shows a weak positive correlation between the proportion of Yaqui and poverty level among females between the ages 25 and 34 in the United States with a correlation coefficient (R) of 0.230 and weighted average of 17.0%, a difference of 22.3%.
Female Poverty Among 25-34 Year Olds Correlation Summary
| Measurement | Hmong | Yaqui |
| Minimum | 5.8% | 4.8% |
| Maximum | 25.3% | 50.6% |
| Range | 19.5% | 45.9% |
| Mean | 13.5% | 23.5% |
| Median | 13.3% | 21.5% |
| Interquartile 25% (IQ1) | 9.6% | 14.9% |
| Interquartile 75% (IQ3) | 16.0% | 28.7% |
| Interquartile Range (IQR) | 6.4% | 13.8% |
| Standard Deviation (Sample) | 4.8% | 10.9% |
| Standard Deviation (Population) | 4.7% | 10.7% |
Similar Demographics by Female Poverty Among 25-34 Year Olds
Demographics Similar to Hmong by Female Poverty Among 25-34 Year Olds
In terms of female poverty among 25-34 year olds, the demographic groups most similar to Hmong are English (13.9%, a difference of 0.020%), Immigrants from Germany (13.9%, a difference of 0.080%), Immigrants from Saudi Arabia (13.9%, a difference of 0.19%), Immigrants from Trinidad and Tobago (14.0%, a difference of 0.35%), and Scottish (13.9%, a difference of 0.39%).
| Demographics | Rating | Rank | Female Poverty Among 25-34 Year Olds |
| Immigrants | Kenya | 28.0 /100 | #193 | Fair 13.8% |
| Moroccans | 25.1 /100 | #194 | Fair 13.8% |
| Immigrants | Cambodia | 24.0 /100 | #195 | Fair 13.9% |
| Scottish | 23.6 /100 | #196 | Fair 13.9% |
| Immigrants | Saudi Arabia | 21.9 /100 | #197 | Fair 13.9% |
| Immigrants | Germany | 20.9 /100 | #198 | Fair 13.9% |
| English | 20.4 /100 | #199 | Fair 13.9% |
| Hmong | 20.3 /100 | #200 | Fair 13.9% |
| Immigrants | Trinidad and Tobago | 17.6 /100 | #201 | Poor 14.0% |
| Welsh | 17.2 /100 | #202 | Poor 14.0% |
| Immigrants | Immigrants | 14.5 /100 | #203 | Poor 14.0% |
| Hawaiians | 13.6 /100 | #204 | Poor 14.1% |
| Immigrants | Africa | 13.4 /100 | #205 | Poor 14.1% |
| Hungarians | 11.8 /100 | #206 | Poor 14.1% |
| Japanese | 11.7 /100 | #207 | Poor 14.1% |
Demographics Similar to Yaqui by Female Poverty Among 25-34 Year Olds
In terms of female poverty among 25-34 year olds, the demographic groups most similar to Yaqui are Chickasaw (17.0%, a difference of 0.020%), African (17.0%, a difference of 0.20%), Ottawa (17.1%, a difference of 0.50%), Immigrants from Cabo Verde (16.9%, a difference of 0.60%), and Honduran (16.9%, a difference of 0.76%).
| Demographics | Rating | Rank | Female Poverty Among 25-34 Year Olds |
| U.S. Virgin Islanders | 0.0 /100 | #300 | Tragic 16.7% |
| Immigrants | Congo | 0.0 /100 | #301 | Tragic 16.7% |
| Alaska Natives | 0.0 /100 | #302 | Tragic 16.8% |
| Immigrants | Mexico | 0.0 /100 | #303 | Tragic 16.8% |
| Hondurans | 0.0 /100 | #304 | Tragic 16.9% |
| Immigrants | Cabo Verde | 0.0 /100 | #305 | Tragic 16.9% |
| Chickasaw | 0.0 /100 | #306 | Tragic 17.0% |
| Yaqui | 0.0 /100 | #307 | Tragic 17.0% |
| Africans | 0.0 /100 | #308 | Tragic 17.0% |
| Ottawa | 0.0 /100 | #309 | Tragic 17.1% |
| Cherokee | 0.0 /100 | #310 | Tragic 17.2% |
| Immigrants | Honduras | 0.0 /100 | #311 | Tragic 17.3% |
| Iroquois | 0.0 /100 | #312 | Tragic 17.5% |
| Colville | 0.0 /100 | #313 | Tragic 17.5% |
| Immigrants | Dominican Republic | 0.0 /100 | #314 | Tragic 17.6% |