Welsh vs Yaqui In Labor Force | Age 25-29
COMPARE
Welsh
Yaqui
In Labor Force | Age 25-29
In Labor Force | Age 25-29 Comparison
Welsh
Yaqui
84.5%
IN LABOR FORCE | AGE 25-29
31.1/ 100
METRIC RATING
190th/ 347
METRIC RANK
82.2%
IN LABOR FORCE | AGE 25-29
0.0/ 100
METRIC RATING
313th/ 347
METRIC RANK
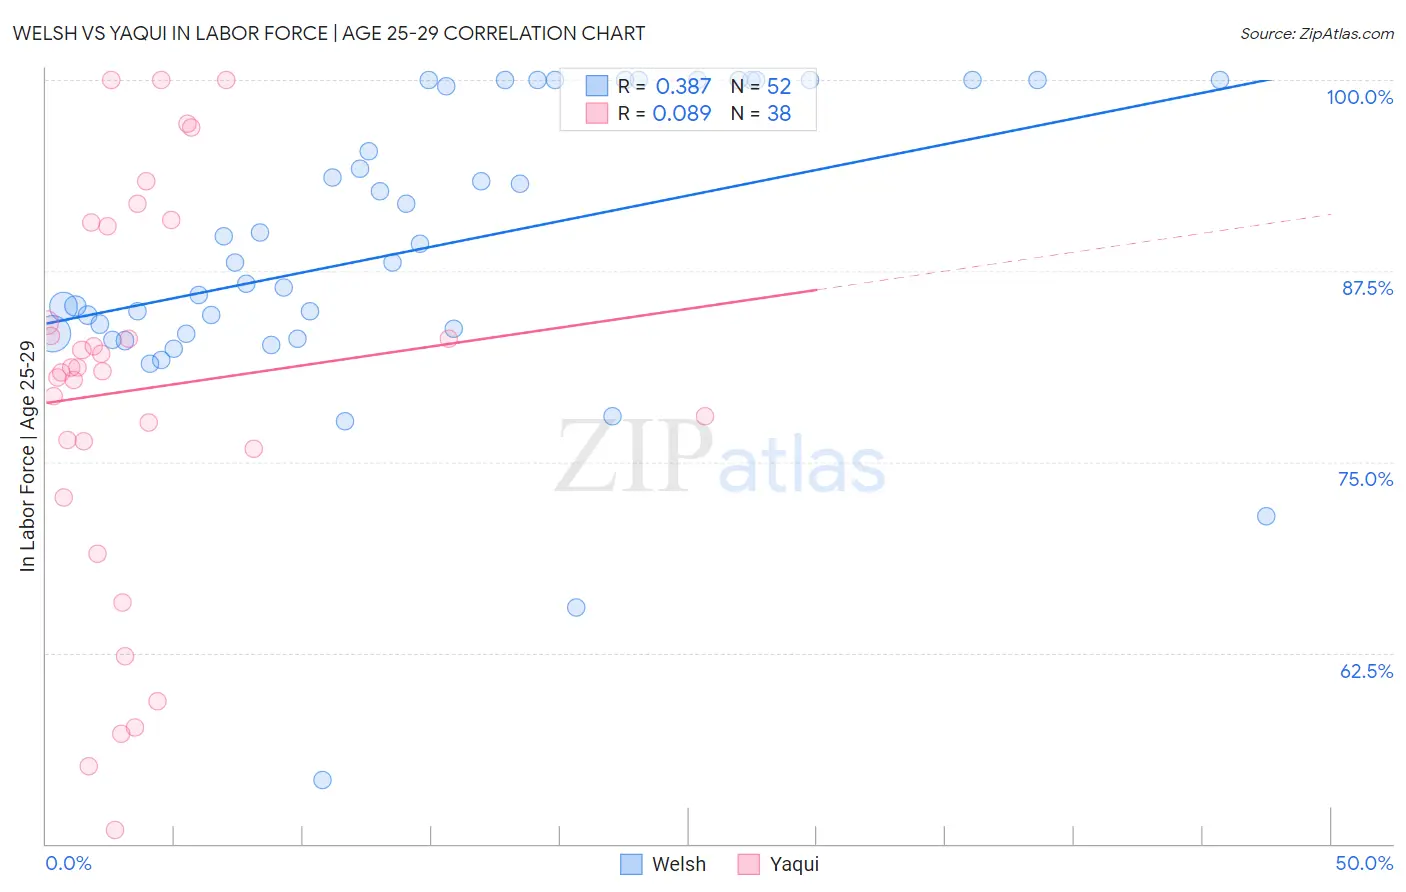
Welsh vs Yaqui In Labor Force | Age 25-29 Correlation Chart
The statistical analysis conducted on geographies consisting of 527,913,112 people shows a mild positive correlation between the proportion of Welsh and labor force participation rate among population between the ages 25 and 29 in the United States with a correlation coefficient (R) of 0.387 and weighted average of 84.5%. Similarly, the statistical analysis conducted on geographies consisting of 107,713,986 people shows a slight positive correlation between the proportion of Yaqui and labor force participation rate among population between the ages 25 and 29 in the United States with a correlation coefficient (R) of 0.089 and weighted average of 82.2%, a difference of 2.9%.
In Labor Force | Age 25-29 Correlation Summary
| Measurement | Welsh | Yaqui |
| Minimum | 54.2% | 50.9% |
| Maximum | 100.0% | 100.0% |
| Range | 45.8% | 49.1% |
| Mean | 89.0% | 79.7% |
| Median | 88.1% | 81.1% |
| Interquartile 25% (IQ1) | 83.4% | 75.9% |
| Interquartile 75% (IQ3) | 100.0% | 90.5% |
| Interquartile Range (IQR) | 16.6% | 14.6% |
| Standard Deviation (Sample) | 9.7% | 12.9% |
| Standard Deviation (Population) | 9.6% | 12.7% |
Similar Demographics by In Labor Force | Age 25-29
Demographics Similar to Welsh by In Labor Force | Age 25-29
In terms of in labor force | age 25-29, the demographic groups most similar to Welsh are Moroccan (84.5%, a difference of 0.010%), Immigrants from Ukraine (84.5%, a difference of 0.020%), Zimbabwean (84.5%, a difference of 0.020%), Immigrants from Belgium (84.6%, a difference of 0.030%), and Immigrants from Portugal (84.6%, a difference of 0.030%).
| Demographics | Rating | Rank | In Labor Force | Age 25-29 |
| Scottish | 40.1 /100 | #183 | Average 84.6% |
| Immigrants | Kuwait | 38.2 /100 | #184 | Fair 84.6% |
| Immigrants | Denmark | 37.0 /100 | #185 | Fair 84.6% |
| Immigrants | Belgium | 35.0 /100 | #186 | Fair 84.6% |
| Immigrants | Portugal | 34.7 /100 | #187 | Fair 84.6% |
| Immigrants | Ukraine | 33.7 /100 | #188 | Fair 84.5% |
| Moroccans | 32.6 /100 | #189 | Fair 84.5% |
| Welsh | 31.1 /100 | #190 | Fair 84.5% |
| Zimbabweans | 28.7 /100 | #191 | Fair 84.5% |
| English | 25.8 /100 | #192 | Fair 84.5% |
| South American Indians | 25.0 /100 | #193 | Fair 84.5% |
| Portuguese | 21.2 /100 | #194 | Fair 84.4% |
| Immigrants | Israel | 20.8 /100 | #195 | Fair 84.4% |
| Immigrants | South Eastern Asia | 19.5 /100 | #196 | Poor 84.4% |
| Tlingit-Haida | 19.3 /100 | #197 | Poor 84.4% |
Demographics Similar to Yaqui by In Labor Force | Age 25-29
In terms of in labor force | age 25-29, the demographic groups most similar to Yaqui are Cherokee (82.1%, a difference of 0.050%), Hispanic or Latino (82.2%, a difference of 0.10%), Osage (82.3%, a difference of 0.17%), Alaskan Athabascan (82.3%, a difference of 0.17%), and Immigrants from Mexico (82.0%, a difference of 0.18%).
| Demographics | Rating | Rank | In Labor Force | Age 25-29 |
| Blackfeet | 0.0 /100 | #306 | Tragic 82.6% |
| Cajuns | 0.0 /100 | #307 | Tragic 82.5% |
| Central American Indians | 0.0 /100 | #308 | Tragic 82.4% |
| Immigrants | Central America | 0.0 /100 | #309 | Tragic 82.4% |
| Osage | 0.0 /100 | #310 | Tragic 82.3% |
| Alaskan Athabascans | 0.0 /100 | #311 | Tragic 82.3% |
| Hispanics or Latinos | 0.0 /100 | #312 | Tragic 82.2% |
| Yaqui | 0.0 /100 | #313 | Tragic 82.2% |
| Cherokee | 0.0 /100 | #314 | Tragic 82.1% |
| Immigrants | Mexico | 0.0 /100 | #315 | Tragic 82.0% |
| Mexicans | 0.0 /100 | #316 | Tragic 81.9% |
| Chickasaw | 0.0 /100 | #317 | Tragic 81.9% |
| Comanche | 0.0 /100 | #318 | Tragic 81.9% |
| Seminole | 0.0 /100 | #319 | Tragic 81.7% |
| Colville | 0.0 /100 | #320 | Tragic 81.6% |