Immigrants from Morocco vs Yaqui In Labor Force | Age 25-29
COMPARE
Immigrants from Morocco
Yaqui
In Labor Force | Age 25-29
In Labor Force | Age 25-29 Comparison
Immigrants from Morocco
Yaqui
85.5%
IN LABOR FORCE | AGE 25-29
99.5/ 100
METRIC RATING
59th/ 347
METRIC RANK
82.2%
IN LABOR FORCE | AGE 25-29
0.0/ 100
METRIC RATING
313th/ 347
METRIC RANK
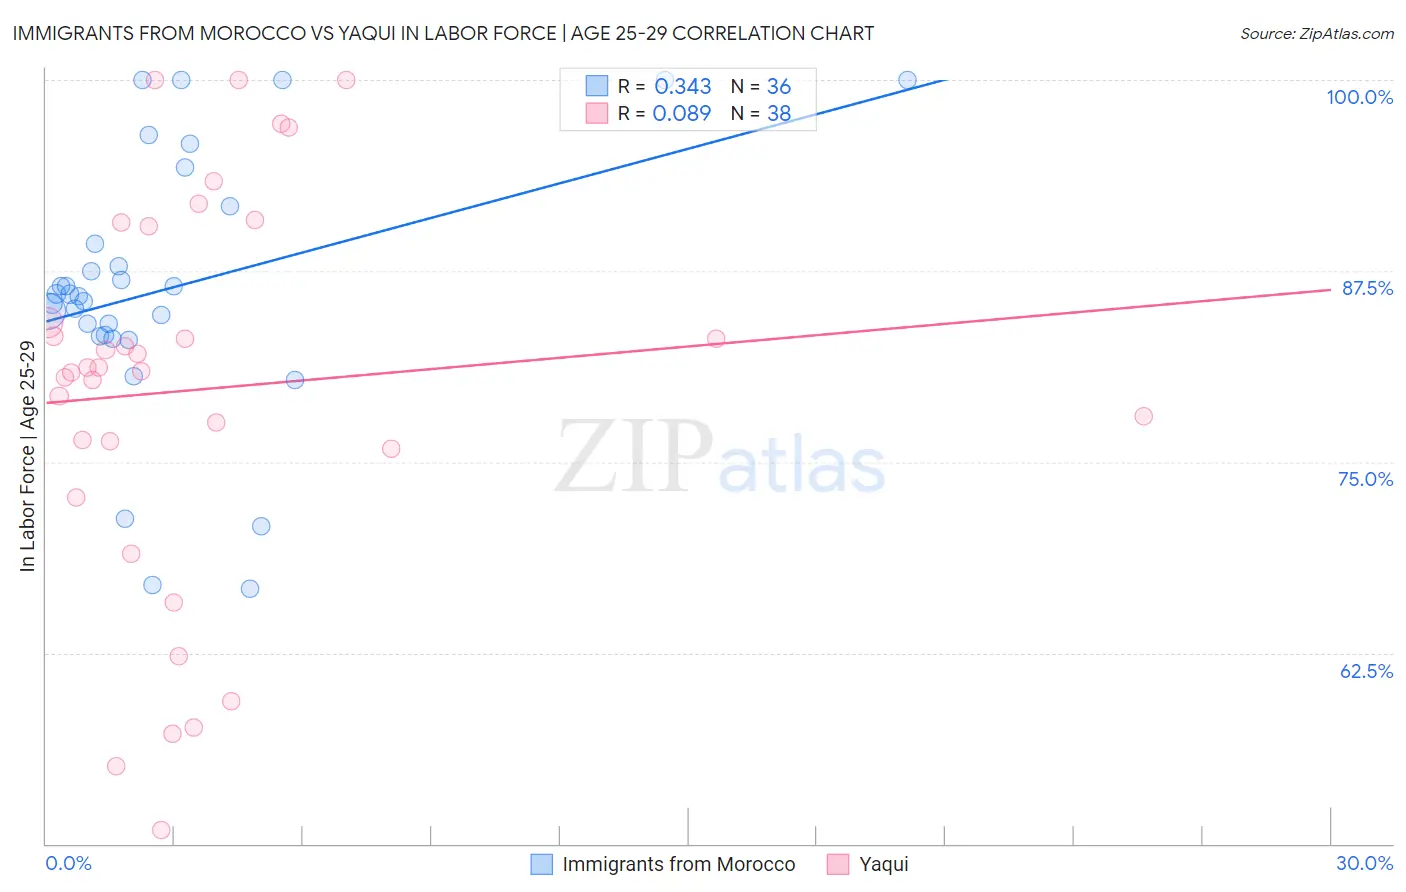
Immigrants from Morocco vs Yaqui In Labor Force | Age 25-29 Correlation Chart
The statistical analysis conducted on geographies consisting of 178,899,306 people shows a mild positive correlation between the proportion of Immigrants from Morocco and labor force participation rate among population between the ages 25 and 29 in the United States with a correlation coefficient (R) of 0.343 and weighted average of 85.5%. Similarly, the statistical analysis conducted on geographies consisting of 107,713,986 people shows a slight positive correlation between the proportion of Yaqui and labor force participation rate among population between the ages 25 and 29 in the United States with a correlation coefficient (R) of 0.089 and weighted average of 82.2%, a difference of 4.1%.
In Labor Force | Age 25-29 Correlation Summary
| Measurement | Immigrants from Morocco | Yaqui |
| Minimum | 66.7% | 50.9% |
| Maximum | 100.0% | 100.0% |
| Range | 33.3% | 49.1% |
| Mean | 86.4% | 79.7% |
| Median | 85.9% | 81.1% |
| Interquartile 25% (IQ1) | 83.3% | 75.9% |
| Interquartile 75% (IQ3) | 90.5% | 90.5% |
| Interquartile Range (IQR) | 7.2% | 14.6% |
| Standard Deviation (Sample) | 8.6% | 12.9% |
| Standard Deviation (Population) | 8.5% | 12.7% |
Similar Demographics by In Labor Force | Age 25-29
Demographics Similar to Immigrants from Morocco by In Labor Force | Age 25-29
In terms of in labor force | age 25-29, the demographic groups most similar to Immigrants from Morocco are Estonian (85.5%, a difference of 0.010%), Greek (85.5%, a difference of 0.010%), Eastern European (85.5%, a difference of 0.020%), Thai (85.5%, a difference of 0.030%), and Serbian (85.5%, a difference of 0.030%).
| Demographics | Rating | Rank | In Labor Force | Age 25-29 |
| Immigrants | Poland | 99.7 /100 | #52 | Exceptional 85.6% |
| Belgians | 99.7 /100 | #53 | Exceptional 85.5% |
| Albanians | 99.7 /100 | #54 | Exceptional 85.5% |
| Immigrants | Brazil | 99.7 /100 | #55 | Exceptional 85.5% |
| Eastern Europeans | 99.6 /100 | #56 | Exceptional 85.5% |
| Estonians | 99.6 /100 | #57 | Exceptional 85.5% |
| Greeks | 99.6 /100 | #58 | Exceptional 85.5% |
| Immigrants | Morocco | 99.5 /100 | #59 | Exceptional 85.5% |
| Thais | 99.5 /100 | #60 | Exceptional 85.5% |
| Serbians | 99.5 /100 | #61 | Exceptional 85.5% |
| Taiwanese | 99.4 /100 | #62 | Exceptional 85.4% |
| Immigrants | Kenya | 99.4 /100 | #63 | Exceptional 85.4% |
| Immigrants | Italy | 99.3 /100 | #64 | Exceptional 85.4% |
| Immigrants | Czechoslovakia | 99.3 /100 | #65 | Exceptional 85.4% |
| Immigrants | Scotland | 99.3 /100 | #66 | Exceptional 85.4% |
Demographics Similar to Yaqui by In Labor Force | Age 25-29
In terms of in labor force | age 25-29, the demographic groups most similar to Yaqui are Cherokee (82.1%, a difference of 0.050%), Hispanic or Latino (82.2%, a difference of 0.10%), Osage (82.3%, a difference of 0.17%), Alaskan Athabascan (82.3%, a difference of 0.17%), and Immigrants from Mexico (82.0%, a difference of 0.18%).
| Demographics | Rating | Rank | In Labor Force | Age 25-29 |
| Blackfeet | 0.0 /100 | #306 | Tragic 82.6% |
| Cajuns | 0.0 /100 | #307 | Tragic 82.5% |
| Central American Indians | 0.0 /100 | #308 | Tragic 82.4% |
| Immigrants | Central America | 0.0 /100 | #309 | Tragic 82.4% |
| Osage | 0.0 /100 | #310 | Tragic 82.3% |
| Alaskan Athabascans | 0.0 /100 | #311 | Tragic 82.3% |
| Hispanics or Latinos | 0.0 /100 | #312 | Tragic 82.2% |
| Yaqui | 0.0 /100 | #313 | Tragic 82.2% |
| Cherokee | 0.0 /100 | #314 | Tragic 82.1% |
| Immigrants | Mexico | 0.0 /100 | #315 | Tragic 82.0% |
| Mexicans | 0.0 /100 | #316 | Tragic 81.9% |
| Chickasaw | 0.0 /100 | #317 | Tragic 81.9% |
| Comanche | 0.0 /100 | #318 | Tragic 81.9% |
| Seminole | 0.0 /100 | #319 | Tragic 81.7% |
| Colville | 0.0 /100 | #320 | Tragic 81.6% |