Immigrants from Taiwan vs Yaqui In Labor Force | Age 25-29
COMPARE
Immigrants from Taiwan
Yaqui
In Labor Force | Age 25-29
In Labor Force | Age 25-29 Comparison
Immigrants from Taiwan
Yaqui
84.7%
IN LABOR FORCE | AGE 25-29
62.2/ 100
METRIC RATING
153rd/ 347
METRIC RANK
82.2%
IN LABOR FORCE | AGE 25-29
0.0/ 100
METRIC RATING
313th/ 347
METRIC RANK
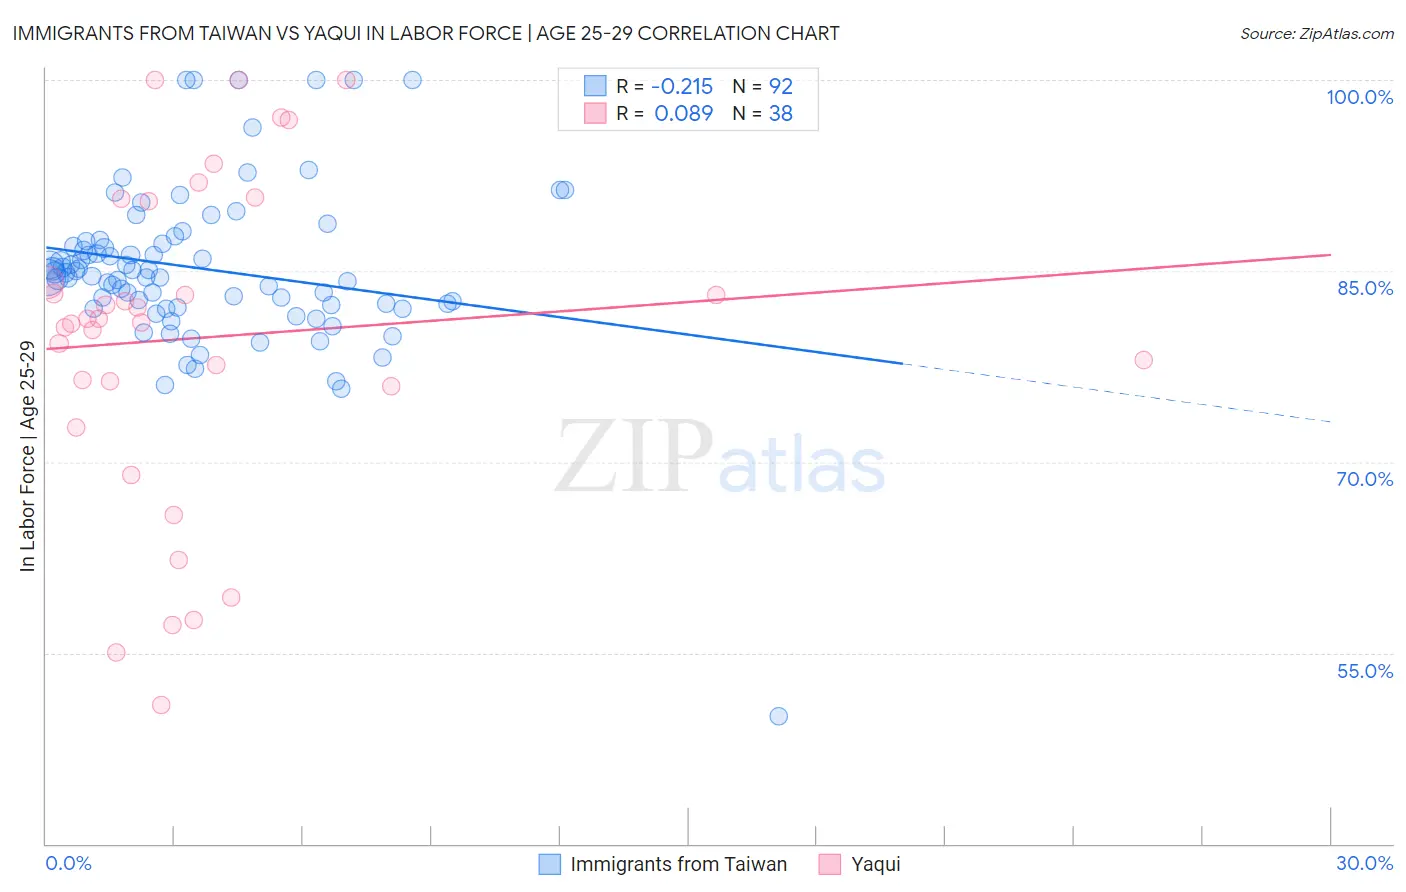
Immigrants from Taiwan vs Yaqui In Labor Force | Age 25-29 Correlation Chart
The statistical analysis conducted on geographies consisting of 298,185,522 people shows a weak negative correlation between the proportion of Immigrants from Taiwan and labor force participation rate among population between the ages 25 and 29 in the United States with a correlation coefficient (R) of -0.215 and weighted average of 84.7%. Similarly, the statistical analysis conducted on geographies consisting of 107,713,986 people shows a slight positive correlation between the proportion of Yaqui and labor force participation rate among population between the ages 25 and 29 in the United States with a correlation coefficient (R) of 0.089 and weighted average of 82.2%, a difference of 3.1%.
In Labor Force | Age 25-29 Correlation Summary
| Measurement | Immigrants from Taiwan | Yaqui |
| Minimum | 50.0% | 50.9% |
| Maximum | 100.0% | 100.0% |
| Range | 50.0% | 49.1% |
| Mean | 85.2% | 79.7% |
| Median | 84.7% | 81.1% |
| Interquartile 25% (IQ1) | 82.3% | 75.9% |
| Interquartile 75% (IQ3) | 87.2% | 90.5% |
| Interquartile Range (IQR) | 5.0% | 14.6% |
| Standard Deviation (Sample) | 6.6% | 12.9% |
| Standard Deviation (Population) | 6.6% | 12.7% |
Similar Demographics by In Labor Force | Age 25-29
Demographics Similar to Immigrants from Taiwan by In Labor Force | Age 25-29
In terms of in labor force | age 25-29, the demographic groups most similar to Immigrants from Taiwan are Colombian (84.7%, a difference of 0.0%), Immigrants from Pakistan (84.7%, a difference of 0.0%), Immigrants from Sri Lanka (84.7%, a difference of 0.0%), Indian (Asian) (84.7%, a difference of 0.010%), and French (84.7%, a difference of 0.010%).
| Demographics | Rating | Rank | In Labor Force | Age 25-29 |
| Icelanders | 68.2 /100 | #146 | Good 84.8% |
| Immigrants | Asia | 68.2 /100 | #147 | Good 84.8% |
| Immigrants | England | 65.2 /100 | #148 | Good 84.7% |
| Peruvians | 64.7 /100 | #149 | Good 84.7% |
| Swiss | 64.7 /100 | #150 | Good 84.7% |
| Colombians | 62.8 /100 | #151 | Good 84.7% |
| Immigrants | Pakistan | 62.7 /100 | #152 | Good 84.7% |
| Immigrants | Taiwan | 62.2 /100 | #153 | Good 84.7% |
| Immigrants | Sri Lanka | 61.7 /100 | #154 | Good 84.7% |
| Indians (Asian) | 61.6 /100 | #155 | Good 84.7% |
| French | 61.0 /100 | #156 | Good 84.7% |
| British | 60.4 /100 | #157 | Good 84.7% |
| Immigrants | Ghana | 60.2 /100 | #158 | Good 84.7% |
| Immigrants | Western Africa | 60.1 /100 | #159 | Good 84.7% |
| Immigrants | Peru | 58.6 /100 | #160 | Average 84.7% |
Demographics Similar to Yaqui by In Labor Force | Age 25-29
In terms of in labor force | age 25-29, the demographic groups most similar to Yaqui are Cherokee (82.1%, a difference of 0.050%), Hispanic or Latino (82.2%, a difference of 0.10%), Osage (82.3%, a difference of 0.17%), Alaskan Athabascan (82.3%, a difference of 0.17%), and Immigrants from Mexico (82.0%, a difference of 0.18%).
| Demographics | Rating | Rank | In Labor Force | Age 25-29 |
| Blackfeet | 0.0 /100 | #306 | Tragic 82.6% |
| Cajuns | 0.0 /100 | #307 | Tragic 82.5% |
| Central American Indians | 0.0 /100 | #308 | Tragic 82.4% |
| Immigrants | Central America | 0.0 /100 | #309 | Tragic 82.4% |
| Osage | 0.0 /100 | #310 | Tragic 82.3% |
| Alaskan Athabascans | 0.0 /100 | #311 | Tragic 82.3% |
| Hispanics or Latinos | 0.0 /100 | #312 | Tragic 82.2% |
| Yaqui | 0.0 /100 | #313 | Tragic 82.2% |
| Cherokee | 0.0 /100 | #314 | Tragic 82.1% |
| Immigrants | Mexico | 0.0 /100 | #315 | Tragic 82.0% |
| Mexicans | 0.0 /100 | #316 | Tragic 81.9% |
| Chickasaw | 0.0 /100 | #317 | Tragic 81.9% |
| Comanche | 0.0 /100 | #318 | Tragic 81.9% |
| Seminole | 0.0 /100 | #319 | Tragic 81.7% |
| Colville | 0.0 /100 | #320 | Tragic 81.6% |