Immigrants from Guatemala vs Yaqui In Labor Force | Age 25-29
COMPARE
Immigrants from Guatemala
Yaqui
In Labor Force | Age 25-29
In Labor Force | Age 25-29 Comparison
Immigrants from Guatemala
Yaqui
83.6%
IN LABOR FORCE | AGE 25-29
0.1/ 100
METRIC RATING
258th/ 347
METRIC RANK
82.2%
IN LABOR FORCE | AGE 25-29
0.0/ 100
METRIC RATING
313th/ 347
METRIC RANK
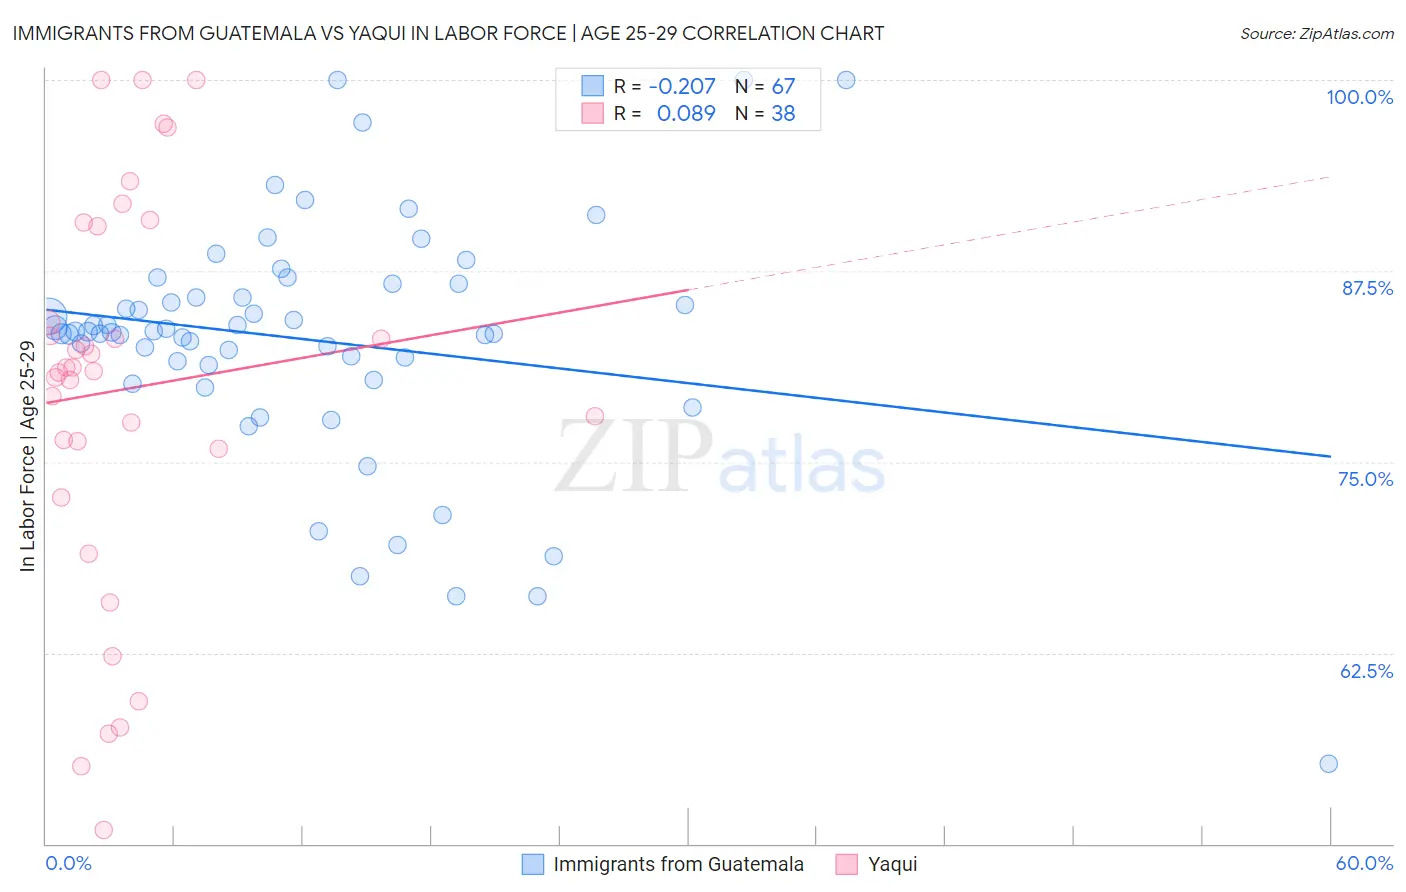
Immigrants from Guatemala vs Yaqui In Labor Force | Age 25-29 Correlation Chart
The statistical analysis conducted on geographies consisting of 377,188,709 people shows a weak negative correlation between the proportion of Immigrants from Guatemala and labor force participation rate among population between the ages 25 and 29 in the United States with a correlation coefficient (R) of -0.207 and weighted average of 83.6%. Similarly, the statistical analysis conducted on geographies consisting of 107,713,986 people shows a slight positive correlation between the proportion of Yaqui and labor force participation rate among population between the ages 25 and 29 in the United States with a correlation coefficient (R) of 0.089 and weighted average of 82.2%, a difference of 1.8%.
In Labor Force | Age 25-29 Correlation Summary
| Measurement | Immigrants from Guatemala | Yaqui |
| Minimum | 55.2% | 50.9% |
| Maximum | 100.0% | 100.0% |
| Range | 44.8% | 49.1% |
| Mean | 83.0% | 79.7% |
| Median | 83.5% | 81.1% |
| Interquartile 25% (IQ1) | 81.4% | 75.9% |
| Interquartile 75% (IQ3) | 86.6% | 90.5% |
| Interquartile Range (IQR) | 5.3% | 14.6% |
| Standard Deviation (Sample) | 7.9% | 12.9% |
| Standard Deviation (Population) | 7.8% | 12.7% |
Similar Demographics by In Labor Force | Age 25-29
Demographics Similar to Immigrants from Guatemala by In Labor Force | Age 25-29
In terms of in labor force | age 25-29, the demographic groups most similar to Immigrants from Guatemala are Spanish (83.6%, a difference of 0.010%), Immigrants from Bahamas (83.6%, a difference of 0.020%), Pennsylvania German (83.6%, a difference of 0.020%), Delaware (83.7%, a difference of 0.040%), and Immigrants from Haiti (83.7%, a difference of 0.050%).
| Demographics | Rating | Rank | In Labor Force | Age 25-29 |
| Bahamians | 0.2 /100 | #251 | Tragic 83.7% |
| Guatemalans | 0.2 /100 | #252 | Tragic 83.7% |
| Immigrants | Trinidad and Tobago | 0.2 /100 | #253 | Tragic 83.7% |
| Spaniards | 0.2 /100 | #254 | Tragic 83.7% |
| Haitians | 0.2 /100 | #255 | Tragic 83.7% |
| Immigrants | Haiti | 0.2 /100 | #256 | Tragic 83.7% |
| Delaware | 0.2 /100 | #257 | Tragic 83.7% |
| Immigrants | Guatemala | 0.1 /100 | #258 | Tragic 83.6% |
| Spanish | 0.1 /100 | #259 | Tragic 83.6% |
| Immigrants | Bahamas | 0.1 /100 | #260 | Tragic 83.6% |
| Pennsylvania Germans | 0.1 /100 | #261 | Tragic 83.6% |
| Immigrants | Fiji | 0.1 /100 | #262 | Tragic 83.6% |
| West Indians | 0.1 /100 | #263 | Tragic 83.5% |
| Puget Sound Salish | 0.1 /100 | #264 | Tragic 83.5% |
| Cubans | 0.1 /100 | #265 | Tragic 83.5% |
Demographics Similar to Yaqui by In Labor Force | Age 25-29
In terms of in labor force | age 25-29, the demographic groups most similar to Yaqui are Cherokee (82.1%, a difference of 0.050%), Hispanic or Latino (82.2%, a difference of 0.10%), Osage (82.3%, a difference of 0.17%), Alaskan Athabascan (82.3%, a difference of 0.17%), and Immigrants from Mexico (82.0%, a difference of 0.18%).
| Demographics | Rating | Rank | In Labor Force | Age 25-29 |
| Blackfeet | 0.0 /100 | #306 | Tragic 82.6% |
| Cajuns | 0.0 /100 | #307 | Tragic 82.5% |
| Central American Indians | 0.0 /100 | #308 | Tragic 82.4% |
| Immigrants | Central America | 0.0 /100 | #309 | Tragic 82.4% |
| Osage | 0.0 /100 | #310 | Tragic 82.3% |
| Alaskan Athabascans | 0.0 /100 | #311 | Tragic 82.3% |
| Hispanics or Latinos | 0.0 /100 | #312 | Tragic 82.2% |
| Yaqui | 0.0 /100 | #313 | Tragic 82.2% |
| Cherokee | 0.0 /100 | #314 | Tragic 82.1% |
| Immigrants | Mexico | 0.0 /100 | #315 | Tragic 82.0% |
| Mexicans | 0.0 /100 | #316 | Tragic 81.9% |
| Chickasaw | 0.0 /100 | #317 | Tragic 81.9% |
| Comanche | 0.0 /100 | #318 | Tragic 81.9% |
| Seminole | 0.0 /100 | #319 | Tragic 81.7% |
| Colville | 0.0 /100 | #320 | Tragic 81.6% |