Hmong vs Immigrants from Micronesia In Labor Force | Age 25-29
COMPARE
Hmong
Immigrants from Micronesia
In Labor Force | Age 25-29
In Labor Force | Age 25-29 Comparison
Hmong
Immigrants from Micronesia
83.7%
IN LABOR FORCE | AGE 25-29
0.3/ 100
METRIC RATING
249th/ 347
METRIC RANK
83.0%
IN LABOR FORCE | AGE 25-29
0.0/ 100
METRIC RATING
289th/ 347
METRIC RANK
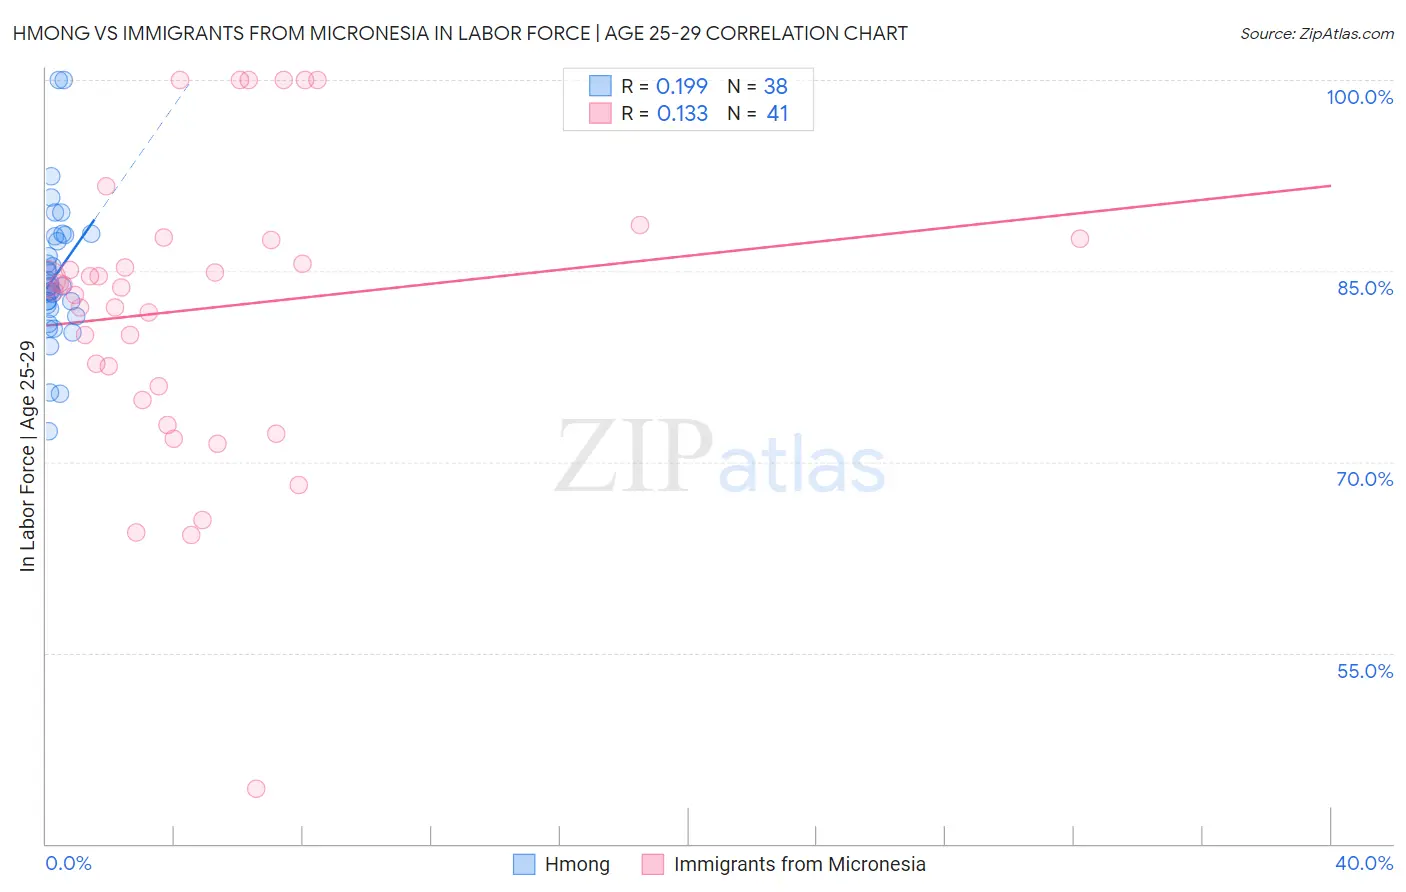
Hmong vs Immigrants from Micronesia In Labor Force | Age 25-29 Correlation Chart
The statistical analysis conducted on geographies consisting of 24,664,732 people shows a poor positive correlation between the proportion of Hmong and labor force participation rate among population between the ages 25 and 29 in the United States with a correlation coefficient (R) of 0.199 and weighted average of 83.7%. Similarly, the statistical analysis conducted on geographies consisting of 61,602,386 people shows a poor positive correlation between the proportion of Immigrants from Micronesia and labor force participation rate among population between the ages 25 and 29 in the United States with a correlation coefficient (R) of 0.133 and weighted average of 83.0%, a difference of 0.87%.
In Labor Force | Age 25-29 Correlation Summary
| Measurement | Hmong | Immigrants from Micronesia |
| Minimum | 72.4% | 44.3% |
| Maximum | 100.0% | 100.0% |
| Range | 27.6% | 55.7% |
| Mean | 84.6% | 82.0% |
| Median | 83.8% | 83.7% |
| Interquartile 25% (IQ1) | 82.0% | 75.4% |
| Interquartile 75% (IQ3) | 87.7% | 87.4% |
| Interquartile Range (IQR) | 5.7% | 12.0% |
| Standard Deviation (Sample) | 5.5% | 11.5% |
| Standard Deviation (Population) | 5.5% | 11.4% |
Similar Demographics by In Labor Force | Age 25-29
Demographics Similar to Hmong by In Labor Force | Age 25-29
In terms of in labor force | age 25-29, the demographic groups most similar to Hmong are Nonimmigrants (83.7%, a difference of 0.010%), Central American (83.7%, a difference of 0.020%), Immigrants from El Salvador (83.7%, a difference of 0.030%), Bahamian (83.7%, a difference of 0.030%), and Cree (83.8%, a difference of 0.040%).
| Demographics | Rating | Rank | In Labor Force | Age 25-29 |
| U.S. Virgin Islanders | 0.6 /100 | #242 | Tragic 83.8% |
| Salvadorans | 0.5 /100 | #243 | Tragic 83.8% |
| Immigrants | Jamaica | 0.4 /100 | #244 | Tragic 83.8% |
| Iroquois | 0.4 /100 | #245 | Tragic 83.8% |
| Cree | 0.3 /100 | #246 | Tragic 83.8% |
| Immigrants | El Salvador | 0.3 /100 | #247 | Tragic 83.7% |
| Immigrants | Nonimmigrants | 0.3 /100 | #248 | Tragic 83.7% |
| Hmong | 0.3 /100 | #249 | Tragic 83.7% |
| Central Americans | 0.2 /100 | #250 | Tragic 83.7% |
| Bahamians | 0.2 /100 | #251 | Tragic 83.7% |
| Guatemalans | 0.2 /100 | #252 | Tragic 83.7% |
| Immigrants | Trinidad and Tobago | 0.2 /100 | #253 | Tragic 83.7% |
| Spaniards | 0.2 /100 | #254 | Tragic 83.7% |
| Haitians | 0.2 /100 | #255 | Tragic 83.7% |
| Immigrants | Haiti | 0.2 /100 | #256 | Tragic 83.7% |
Demographics Similar to Immigrants from Micronesia by In Labor Force | Age 25-29
In terms of in labor force | age 25-29, the demographic groups most similar to Immigrants from Micronesia are Ottawa (83.0%, a difference of 0.020%), Immigrants from Bangladesh (83.0%, a difference of 0.030%), Hawaiian (83.0%, a difference of 0.030%), Guyanese (83.0%, a difference of 0.050%), and Immigrants from Guyana (83.0%, a difference of 0.050%).
| Demographics | Rating | Rank | In Labor Force | Age 25-29 |
| Americans | 0.0 /100 | #282 | Tragic 83.1% |
| Immigrants | Azores | 0.0 /100 | #283 | Tragic 83.1% |
| Nicaraguans | 0.0 /100 | #284 | Tragic 83.1% |
| Belizeans | 0.0 /100 | #285 | Tragic 83.1% |
| Mexican American Indians | 0.0 /100 | #286 | Tragic 83.0% |
| Guyanese | 0.0 /100 | #287 | Tragic 83.0% |
| Ottawa | 0.0 /100 | #288 | Tragic 83.0% |
| Immigrants | Micronesia | 0.0 /100 | #289 | Tragic 83.0% |
| Immigrants | Bangladesh | 0.0 /100 | #290 | Tragic 83.0% |
| Hawaiians | 0.0 /100 | #291 | Tragic 83.0% |
| Immigrants | Guyana | 0.0 /100 | #292 | Tragic 83.0% |
| Immigrants | Latin America | 0.0 /100 | #293 | Tragic 82.9% |
| Nepalese | 0.0 /100 | #294 | Tragic 82.9% |
| Chippewa | 0.0 /100 | #295 | Tragic 82.9% |
| Immigrants | Nicaragua | 0.0 /100 | #296 | Tragic 82.9% |