Hispanic or Latino vs Panamanian In Labor Force | Age 25-29
COMPARE
Hispanic or Latino
Panamanian
In Labor Force | Age 25-29
In Labor Force | Age 25-29 Comparison
Hispanics or Latinos
Panamanians
82.2%
IN LABOR FORCE | AGE 25-29
0.0/ 100
METRIC RATING
312th/ 347
METRIC RANK
84.2%
IN LABOR FORCE | AGE 25-29
4.5/ 100
METRIC RATING
232nd/ 347
METRIC RANK
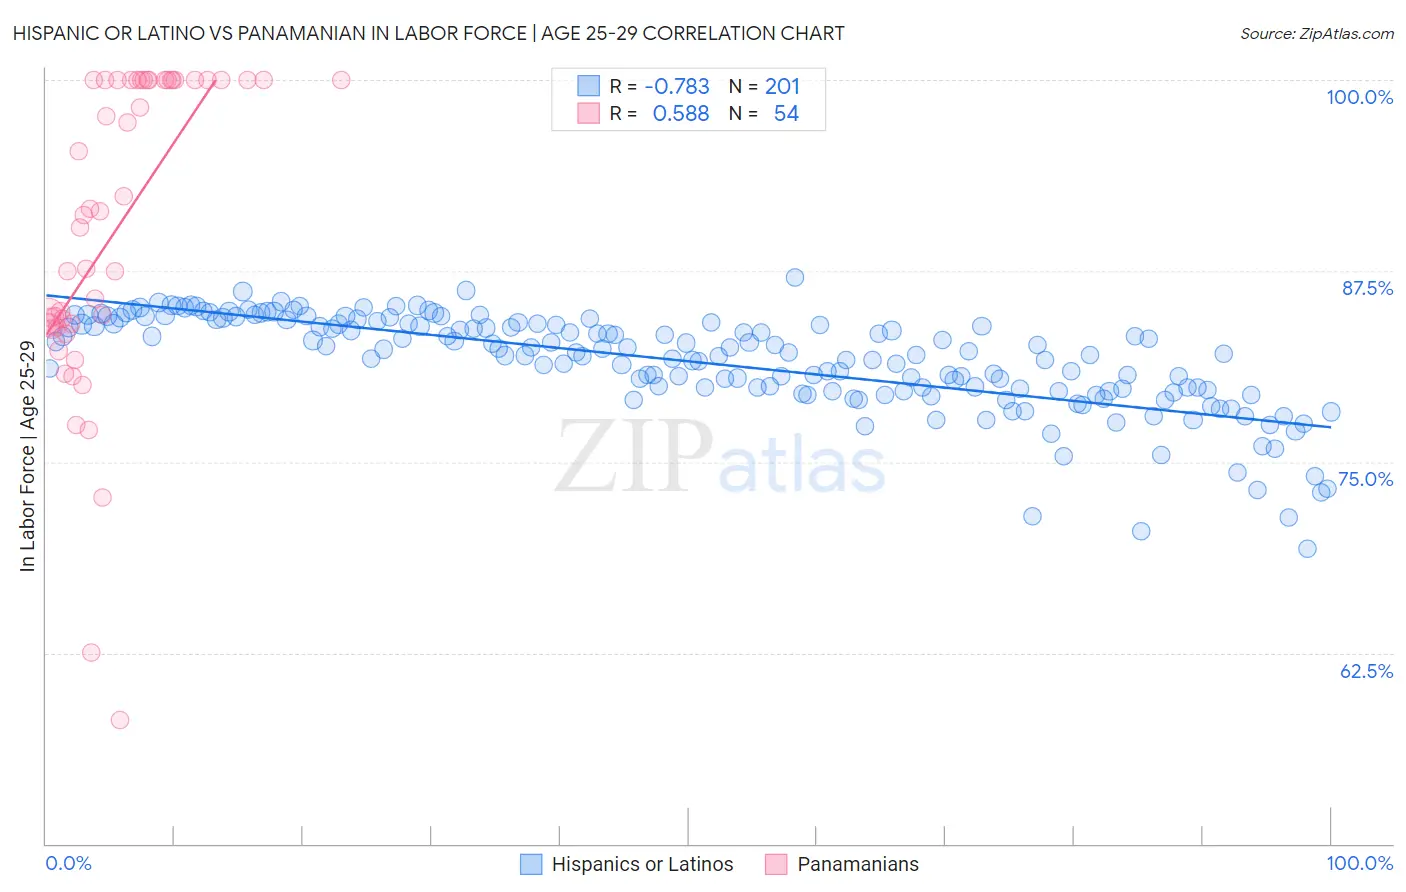
Hispanic or Latino vs Panamanian In Labor Force | Age 25-29 Correlation Chart
The statistical analysis conducted on geographies consisting of 577,042,190 people shows a strong negative correlation between the proportion of Hispanics or Latinos and labor force participation rate among population between the ages 25 and 29 in the United States with a correlation coefficient (R) of -0.783 and weighted average of 82.2%. Similarly, the statistical analysis conducted on geographies consisting of 281,182,728 people shows a substantial positive correlation between the proportion of Panamanians and labor force participation rate among population between the ages 25 and 29 in the United States with a correlation coefficient (R) of 0.588 and weighted average of 84.2%, a difference of 2.4%.
In Labor Force | Age 25-29 Correlation Summary
| Measurement | Hispanic or Latino | Panamanian |
| Minimum | 69.3% | 58.1% |
| Maximum | 87.0% | 100.0% |
| Range | 17.7% | 41.9% |
| Mean | 81.6% | 90.2% |
| Median | 82.2% | 91.3% |
| Interquartile 25% (IQ1) | 79.7% | 83.9% |
| Interquartile 75% (IQ3) | 84.1% | 100.0% |
| Interquartile Range (IQR) | 4.4% | 16.1% |
| Standard Deviation (Sample) | 3.2% | 10.1% |
| Standard Deviation (Population) | 3.2% | 10.0% |
Similar Demographics by In Labor Force | Age 25-29
Demographics Similar to Hispanics or Latinos by In Labor Force | Age 25-29
In terms of in labor force | age 25-29, the demographic groups most similar to Hispanics or Latinos are Alaskan Athabascan (82.3%, a difference of 0.070%), Osage (82.3%, a difference of 0.080%), Yaqui (82.2%, a difference of 0.10%), Cherokee (82.1%, a difference of 0.14%), and Immigrants from Central America (82.4%, a difference of 0.21%).
| Demographics | Rating | Rank | In Labor Force | Age 25-29 |
| Blacks/African Americans | 0.0 /100 | #305 | Tragic 82.6% |
| Blackfeet | 0.0 /100 | #306 | Tragic 82.6% |
| Cajuns | 0.0 /100 | #307 | Tragic 82.5% |
| Central American Indians | 0.0 /100 | #308 | Tragic 82.4% |
| Immigrants | Central America | 0.0 /100 | #309 | Tragic 82.4% |
| Osage | 0.0 /100 | #310 | Tragic 82.3% |
| Alaskan Athabascans | 0.0 /100 | #311 | Tragic 82.3% |
| Hispanics or Latinos | 0.0 /100 | #312 | Tragic 82.2% |
| Yaqui | 0.0 /100 | #313 | Tragic 82.2% |
| Cherokee | 0.0 /100 | #314 | Tragic 82.1% |
| Immigrants | Mexico | 0.0 /100 | #315 | Tragic 82.0% |
| Mexicans | 0.0 /100 | #316 | Tragic 81.9% |
| Chickasaw | 0.0 /100 | #317 | Tragic 81.9% |
| Comanche | 0.0 /100 | #318 | Tragic 81.9% |
| Seminole | 0.0 /100 | #319 | Tragic 81.7% |
Demographics Similar to Panamanians by In Labor Force | Age 25-29
In terms of in labor force | age 25-29, the demographic groups most similar to Panamanians are White/Caucasian (84.2%, a difference of 0.010%), Immigrants from Philippines (84.2%, a difference of 0.010%), Immigrants from Oceania (84.2%, a difference of 0.020%), French American Indian (84.2%, a difference of 0.040%), and Immigrants from Panama (84.2%, a difference of 0.040%).
| Demographics | Rating | Rank | In Labor Force | Age 25-29 |
| Koreans | 5.9 /100 | #225 | Tragic 84.2% |
| Immigrants | Congo | 5.8 /100 | #226 | Tragic 84.2% |
| French American Indians | 5.5 /100 | #227 | Tragic 84.2% |
| Immigrants | Panama | 5.5 /100 | #228 | Tragic 84.2% |
| Immigrants | Oceania | 5.0 /100 | #229 | Tragic 84.2% |
| Whites/Caucasians | 4.8 /100 | #230 | Tragic 84.2% |
| Immigrants | Philippines | 4.7 /100 | #231 | Tragic 84.2% |
| Panamanians | 4.5 /100 | #232 | Tragic 84.2% |
| Immigrants | Western Asia | 2.7 /100 | #233 | Tragic 84.1% |
| Barbadians | 1.0 /100 | #234 | Tragic 83.9% |
| Iraqis | 0.9 /100 | #235 | Tragic 83.9% |
| Guamanians/Chamorros | 0.9 /100 | #236 | Tragic 83.9% |
| Immigrants | Immigrants | 0.9 /100 | #237 | Tragic 83.9% |
| Immigrants | Uzbekistan | 0.8 /100 | #238 | Tragic 83.9% |
| Jamaicans | 0.8 /100 | #239 | Tragic 83.9% |