Immigrants from Ecuador vs Panamanian In Labor Force | Age 25-29
COMPARE
Immigrants from Ecuador
Panamanian
In Labor Force | Age 25-29
In Labor Force | Age 25-29 Comparison
Immigrants from Ecuador
Panamanians
84.3%
IN LABOR FORCE | AGE 25-29
9.3/ 100
METRIC RATING
217th/ 347
METRIC RANK
84.2%
IN LABOR FORCE | AGE 25-29
4.5/ 100
METRIC RATING
232nd/ 347
METRIC RANK
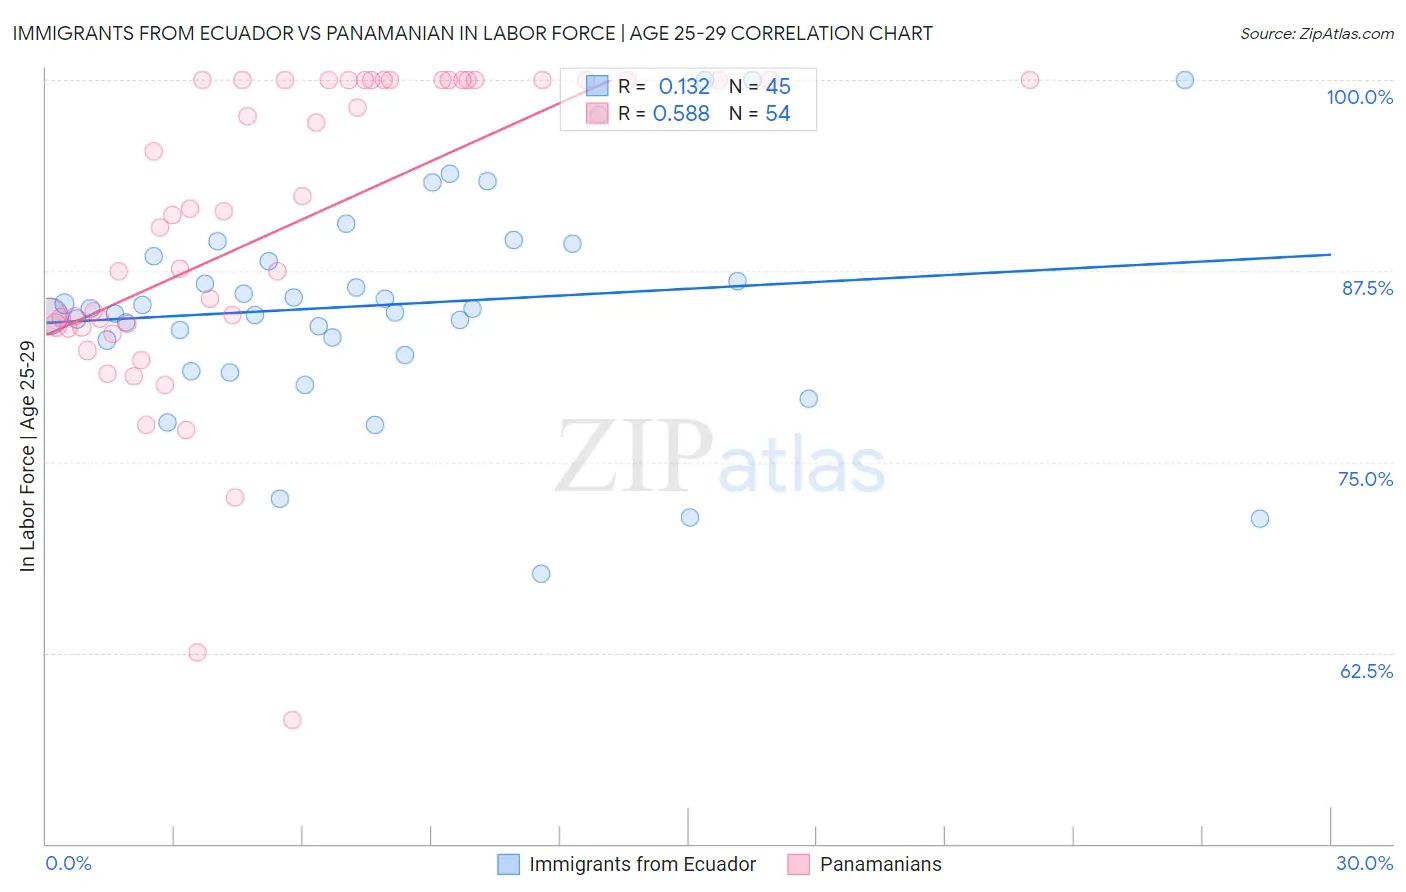
Immigrants from Ecuador vs Panamanian In Labor Force | Age 25-29 Correlation Chart
The statistical analysis conducted on geographies consisting of 270,970,556 people shows a poor positive correlation between the proportion of Immigrants from Ecuador and labor force participation rate among population between the ages 25 and 29 in the United States with a correlation coefficient (R) of 0.132 and weighted average of 84.3%. Similarly, the statistical analysis conducted on geographies consisting of 281,182,728 people shows a substantial positive correlation between the proportion of Panamanians and labor force participation rate among population between the ages 25 and 29 in the United States with a correlation coefficient (R) of 0.588 and weighted average of 84.2%, a difference of 0.14%.
In Labor Force | Age 25-29 Correlation Summary
| Measurement | Immigrants from Ecuador | Panamanian |
| Minimum | 67.7% | 58.1% |
| Maximum | 100.0% | 100.0% |
| Range | 32.3% | 41.9% |
| Mean | 85.3% | 90.2% |
| Median | 85.0% | 91.3% |
| Interquartile 25% (IQ1) | 82.5% | 83.9% |
| Interquartile 75% (IQ3) | 88.9% | 100.0% |
| Interquartile Range (IQR) | 6.4% | 16.1% |
| Standard Deviation (Sample) | 7.1% | 10.1% |
| Standard Deviation (Population) | 7.0% | 10.0% |
Demographics Similar to Immigrants from Ecuador and Panamanians by In Labor Force | Age 25-29
In terms of in labor force | age 25-29, the demographic groups most similar to Immigrants from Ecuador are Israeli (84.3%, a difference of 0.0%), Immigrants from Nigeria (84.3%, a difference of 0.010%), Immigrants from Saudi Arabia (84.3%, a difference of 0.010%), Immigrants from Syria (84.3%, a difference of 0.030%), and Lebanese (84.3%, a difference of 0.040%). Similarly, the demographic groups most similar to Panamanians are White/Caucasian (84.2%, a difference of 0.010%), Immigrants from Philippines (84.2%, a difference of 0.010%), Immigrants from Oceania (84.2%, a difference of 0.020%), French American Indian (84.2%, a difference of 0.040%), and Immigrants from Panama (84.2%, a difference of 0.040%).
| Demographics | Rating | Rank | In Labor Force | Age 25-29 |
| Lebanese | 11.1 /100 | #214 | Poor 84.3% |
| Immigrants | Syria | 10.7 /100 | #215 | Poor 84.3% |
| Israelis | 9.3 /100 | #216 | Tragic 84.3% |
| Immigrants | Ecuador | 9.3 /100 | #217 | Tragic 84.3% |
| Immigrants | Nigeria | 9.0 /100 | #218 | Tragic 84.3% |
| Immigrants | Saudi Arabia | 8.8 /100 | #219 | Tragic 84.3% |
| Nigerians | 7.2 /100 | #220 | Tragic 84.3% |
| Arabs | 6.8 /100 | #221 | Tragic 84.2% |
| Jordanians | 6.7 /100 | #222 | Tragic 84.2% |
| Scotch-Irish | 6.5 /100 | #223 | Tragic 84.2% |
| Immigrants | West Indies | 6.0 /100 | #224 | Tragic 84.2% |
| Koreans | 5.9 /100 | #225 | Tragic 84.2% |
| Immigrants | Congo | 5.8 /100 | #226 | Tragic 84.2% |
| French American Indians | 5.5 /100 | #227 | Tragic 84.2% |
| Immigrants | Panama | 5.5 /100 | #228 | Tragic 84.2% |
| Immigrants | Oceania | 5.0 /100 | #229 | Tragic 84.2% |
| Whites/Caucasians | 4.8 /100 | #230 | Tragic 84.2% |
| Immigrants | Philippines | 4.7 /100 | #231 | Tragic 84.2% |
| Panamanians | 4.5 /100 | #232 | Tragic 84.2% |
| Immigrants | Western Asia | 2.7 /100 | #233 | Tragic 84.1% |
| Barbadians | 1.0 /100 | #234 | Tragic 83.9% |