Immigrants from Ghana vs Panamanian In Labor Force | Age 25-29
COMPARE
Immigrants from Ghana
Panamanian
In Labor Force | Age 25-29
In Labor Force | Age 25-29 Comparison
Immigrants from Ghana
Panamanians
84.7%
IN LABOR FORCE | AGE 25-29
60.2/ 100
METRIC RATING
158th/ 347
METRIC RANK
84.2%
IN LABOR FORCE | AGE 25-29
4.5/ 100
METRIC RATING
232nd/ 347
METRIC RANK
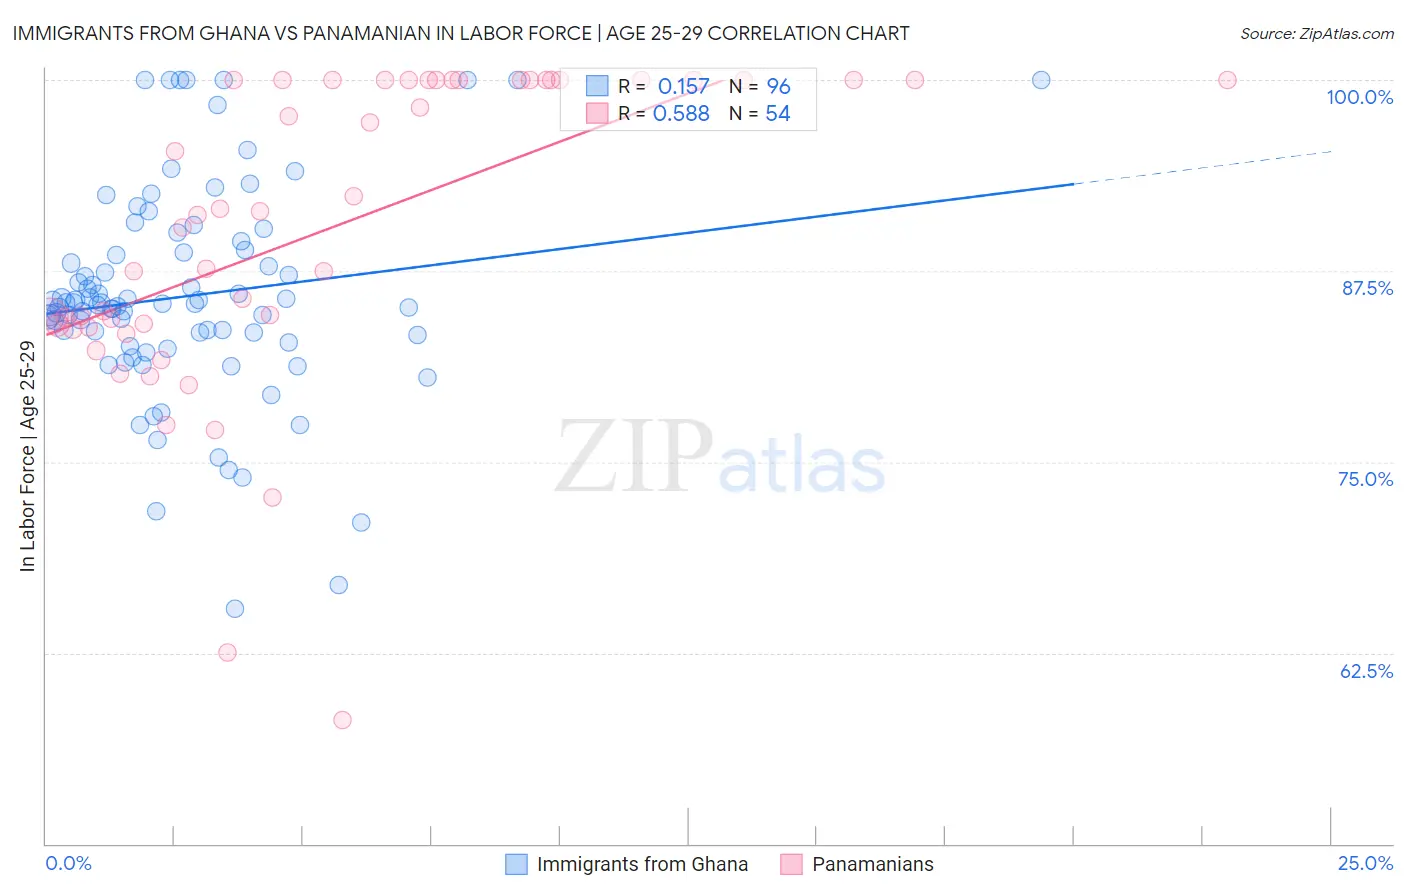
Immigrants from Ghana vs Panamanian In Labor Force | Age 25-29 Correlation Chart
The statistical analysis conducted on geographies consisting of 199,929,683 people shows a poor positive correlation between the proportion of Immigrants from Ghana and labor force participation rate among population between the ages 25 and 29 in the United States with a correlation coefficient (R) of 0.157 and weighted average of 84.7%. Similarly, the statistical analysis conducted on geographies consisting of 281,182,728 people shows a substantial positive correlation between the proportion of Panamanians and labor force participation rate among population between the ages 25 and 29 in the United States with a correlation coefficient (R) of 0.588 and weighted average of 84.2%, a difference of 0.64%.
In Labor Force | Age 25-29 Correlation Summary
| Measurement | Immigrants from Ghana | Panamanian |
| Minimum | 65.4% | 58.1% |
| Maximum | 100.0% | 100.0% |
| Range | 34.6% | 41.9% |
| Mean | 85.9% | 90.2% |
| Median | 85.4% | 91.3% |
| Interquartile 25% (IQ1) | 83.1% | 83.9% |
| Interquartile 75% (IQ3) | 88.8% | 100.0% |
| Interquartile Range (IQR) | 5.7% | 16.1% |
| Standard Deviation (Sample) | 7.0% | 10.1% |
| Standard Deviation (Population) | 6.9% | 10.0% |
Similar Demographics by In Labor Force | Age 25-29
Demographics Similar to Immigrants from Ghana by In Labor Force | Age 25-29
In terms of in labor force | age 25-29, the demographic groups most similar to Immigrants from Ghana are British (84.7%, a difference of 0.0%), Immigrants from Western Africa (84.7%, a difference of 0.0%), Immigrants from Sri Lanka (84.7%, a difference of 0.010%), Indian (Asian) (84.7%, a difference of 0.010%), and French (84.7%, a difference of 0.010%).
| Demographics | Rating | Rank | In Labor Force | Age 25-29 |
| Colombians | 62.8 /100 | #151 | Good 84.7% |
| Immigrants | Pakistan | 62.7 /100 | #152 | Good 84.7% |
| Immigrants | Taiwan | 62.2 /100 | #153 | Good 84.7% |
| Immigrants | Sri Lanka | 61.7 /100 | #154 | Good 84.7% |
| Indians (Asian) | 61.6 /100 | #155 | Good 84.7% |
| French | 61.0 /100 | #156 | Good 84.7% |
| British | 60.4 /100 | #157 | Good 84.7% |
| Immigrants | Ghana | 60.2 /100 | #158 | Good 84.7% |
| Immigrants | Western Africa | 60.1 /100 | #159 | Good 84.7% |
| Immigrants | Peru | 58.6 /100 | #160 | Average 84.7% |
| Canadians | 58.5 /100 | #161 | Average 84.7% |
| Immigrants | Colombia | 58.3 /100 | #162 | Average 84.7% |
| Argentineans | 57.9 /100 | #163 | Average 84.7% |
| Ghanaians | 57.6 /100 | #164 | Average 84.7% |
| Immigrants | Burma/Myanmar | 57.4 /100 | #165 | Average 84.7% |
Demographics Similar to Panamanians by In Labor Force | Age 25-29
In terms of in labor force | age 25-29, the demographic groups most similar to Panamanians are White/Caucasian (84.2%, a difference of 0.010%), Immigrants from Philippines (84.2%, a difference of 0.010%), Immigrants from Oceania (84.2%, a difference of 0.020%), French American Indian (84.2%, a difference of 0.040%), and Immigrants from Panama (84.2%, a difference of 0.040%).
| Demographics | Rating | Rank | In Labor Force | Age 25-29 |
| Koreans | 5.9 /100 | #225 | Tragic 84.2% |
| Immigrants | Congo | 5.8 /100 | #226 | Tragic 84.2% |
| French American Indians | 5.5 /100 | #227 | Tragic 84.2% |
| Immigrants | Panama | 5.5 /100 | #228 | Tragic 84.2% |
| Immigrants | Oceania | 5.0 /100 | #229 | Tragic 84.2% |
| Whites/Caucasians | 4.8 /100 | #230 | Tragic 84.2% |
| Immigrants | Philippines | 4.7 /100 | #231 | Tragic 84.2% |
| Panamanians | 4.5 /100 | #232 | Tragic 84.2% |
| Immigrants | Western Asia | 2.7 /100 | #233 | Tragic 84.1% |
| Barbadians | 1.0 /100 | #234 | Tragic 83.9% |
| Iraqis | 0.9 /100 | #235 | Tragic 83.9% |
| Guamanians/Chamorros | 0.9 /100 | #236 | Tragic 83.9% |
| Immigrants | Immigrants | 0.9 /100 | #237 | Tragic 83.9% |
| Immigrants | Uzbekistan | 0.8 /100 | #238 | Tragic 83.9% |
| Jamaicans | 0.8 /100 | #239 | Tragic 83.9% |