Scottish vs Panamanian In Labor Force | Age 25-29
COMPARE
Scottish
Panamanian
In Labor Force | Age 25-29
In Labor Force | Age 25-29 Comparison
Scottish
Panamanians
84.6%
IN LABOR FORCE | AGE 25-29
40.1/ 100
METRIC RATING
183rd/ 347
METRIC RANK
84.2%
IN LABOR FORCE | AGE 25-29
4.5/ 100
METRIC RATING
232nd/ 347
METRIC RANK
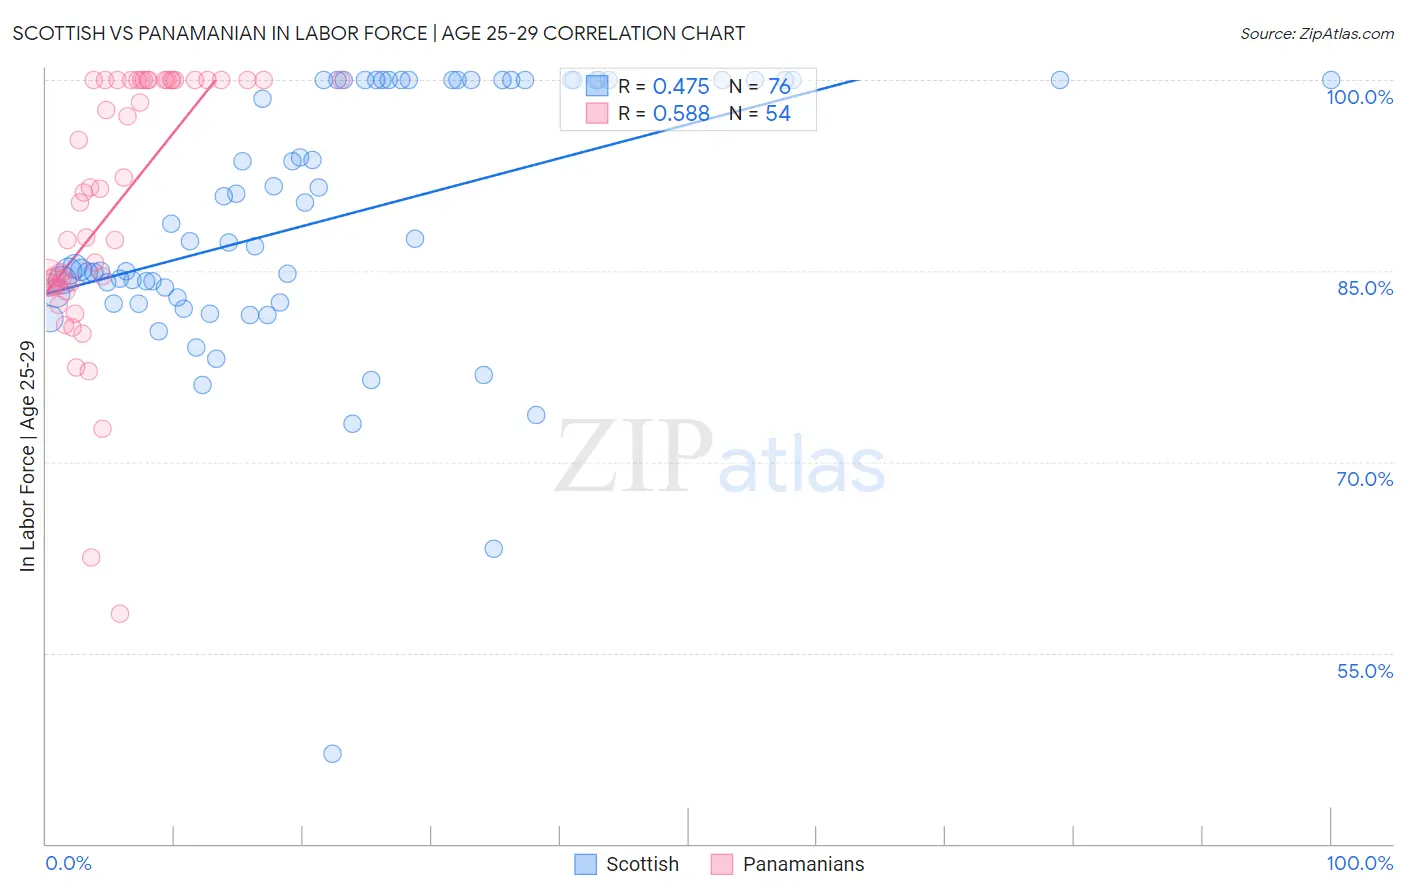
Scottish vs Panamanian In Labor Force | Age 25-29 Correlation Chart
The statistical analysis conducted on geographies consisting of 565,804,130 people shows a moderate positive correlation between the proportion of Scottish and labor force participation rate among population between the ages 25 and 29 in the United States with a correlation coefficient (R) of 0.475 and weighted average of 84.6%. Similarly, the statistical analysis conducted on geographies consisting of 281,182,728 people shows a substantial positive correlation between the proportion of Panamanians and labor force participation rate among population between the ages 25 and 29 in the United States with a correlation coefficient (R) of 0.588 and weighted average of 84.2%, a difference of 0.49%.
In Labor Force | Age 25-29 Correlation Summary
| Measurement | Scottish | Panamanian |
| Minimum | 47.0% | 58.1% |
| Maximum | 100.0% | 100.0% |
| Range | 53.0% | 41.9% |
| Mean | 89.2% | 90.2% |
| Median | 87.4% | 91.3% |
| Interquartile 25% (IQ1) | 83.1% | 83.9% |
| Interquartile 75% (IQ3) | 100.0% | 100.0% |
| Interquartile Range (IQR) | 16.9% | 16.1% |
| Standard Deviation (Sample) | 10.2% | 10.1% |
| Standard Deviation (Population) | 10.1% | 10.0% |
Similar Demographics by In Labor Force | Age 25-29
Demographics Similar to Scottish by In Labor Force | Age 25-29
In terms of in labor force | age 25-29, the demographic groups most similar to Scottish are European (84.6%, a difference of 0.0%), Immigrants from Norway (84.6%, a difference of 0.010%), Immigrants from Kuwait (84.6%, a difference of 0.010%), Immigrants from South America (84.6%, a difference of 0.020%), and Immigrants from Denmark (84.6%, a difference of 0.020%).
| Demographics | Rating | Rank | In Labor Force | Age 25-29 |
| Malaysians | 46.8 /100 | #176 | Average 84.6% |
| Immigrants | China | 45.7 /100 | #177 | Average 84.6% |
| Immigrants | Thailand | 45.2 /100 | #178 | Average 84.6% |
| Immigrants | Argentina | 44.0 /100 | #179 | Average 84.6% |
| Immigrants | South America | 42.9 /100 | #180 | Average 84.6% |
| Immigrants | Norway | 41.9 /100 | #181 | Average 84.6% |
| Europeans | 40.3 /100 | #182 | Average 84.6% |
| Scottish | 40.1 /100 | #183 | Average 84.6% |
| Immigrants | Kuwait | 38.2 /100 | #184 | Fair 84.6% |
| Immigrants | Denmark | 37.0 /100 | #185 | Fair 84.6% |
| Immigrants | Belgium | 35.0 /100 | #186 | Fair 84.6% |
| Immigrants | Portugal | 34.7 /100 | #187 | Fair 84.6% |
| Immigrants | Ukraine | 33.7 /100 | #188 | Fair 84.5% |
| Moroccans | 32.6 /100 | #189 | Fair 84.5% |
| Welsh | 31.1 /100 | #190 | Fair 84.5% |
Demographics Similar to Panamanians by In Labor Force | Age 25-29
In terms of in labor force | age 25-29, the demographic groups most similar to Panamanians are White/Caucasian (84.2%, a difference of 0.010%), Immigrants from Philippines (84.2%, a difference of 0.010%), Immigrants from Oceania (84.2%, a difference of 0.020%), French American Indian (84.2%, a difference of 0.040%), and Immigrants from Panama (84.2%, a difference of 0.040%).
| Demographics | Rating | Rank | In Labor Force | Age 25-29 |
| Koreans | 5.9 /100 | #225 | Tragic 84.2% |
| Immigrants | Congo | 5.8 /100 | #226 | Tragic 84.2% |
| French American Indians | 5.5 /100 | #227 | Tragic 84.2% |
| Immigrants | Panama | 5.5 /100 | #228 | Tragic 84.2% |
| Immigrants | Oceania | 5.0 /100 | #229 | Tragic 84.2% |
| Whites/Caucasians | 4.8 /100 | #230 | Tragic 84.2% |
| Immigrants | Philippines | 4.7 /100 | #231 | Tragic 84.2% |
| Panamanians | 4.5 /100 | #232 | Tragic 84.2% |
| Immigrants | Western Asia | 2.7 /100 | #233 | Tragic 84.1% |
| Barbadians | 1.0 /100 | #234 | Tragic 83.9% |
| Iraqis | 0.9 /100 | #235 | Tragic 83.9% |
| Guamanians/Chamorros | 0.9 /100 | #236 | Tragic 83.9% |
| Immigrants | Immigrants | 0.9 /100 | #237 | Tragic 83.9% |
| Immigrants | Uzbekistan | 0.8 /100 | #238 | Tragic 83.9% |
| Jamaicans | 0.8 /100 | #239 | Tragic 83.9% |