Hispanic or Latino vs Polish In Labor Force | Age 25-29
COMPARE
Hispanic or Latino
Polish
In Labor Force | Age 25-29
In Labor Force | Age 25-29 Comparison
Hispanics or Latinos
Poles
82.2%
IN LABOR FORCE | AGE 25-29
0.0/ 100
METRIC RATING
312th/ 347
METRIC RANK
85.8%
IN LABOR FORCE | AGE 25-29
99.9/ 100
METRIC RATING
37th/ 347
METRIC RANK
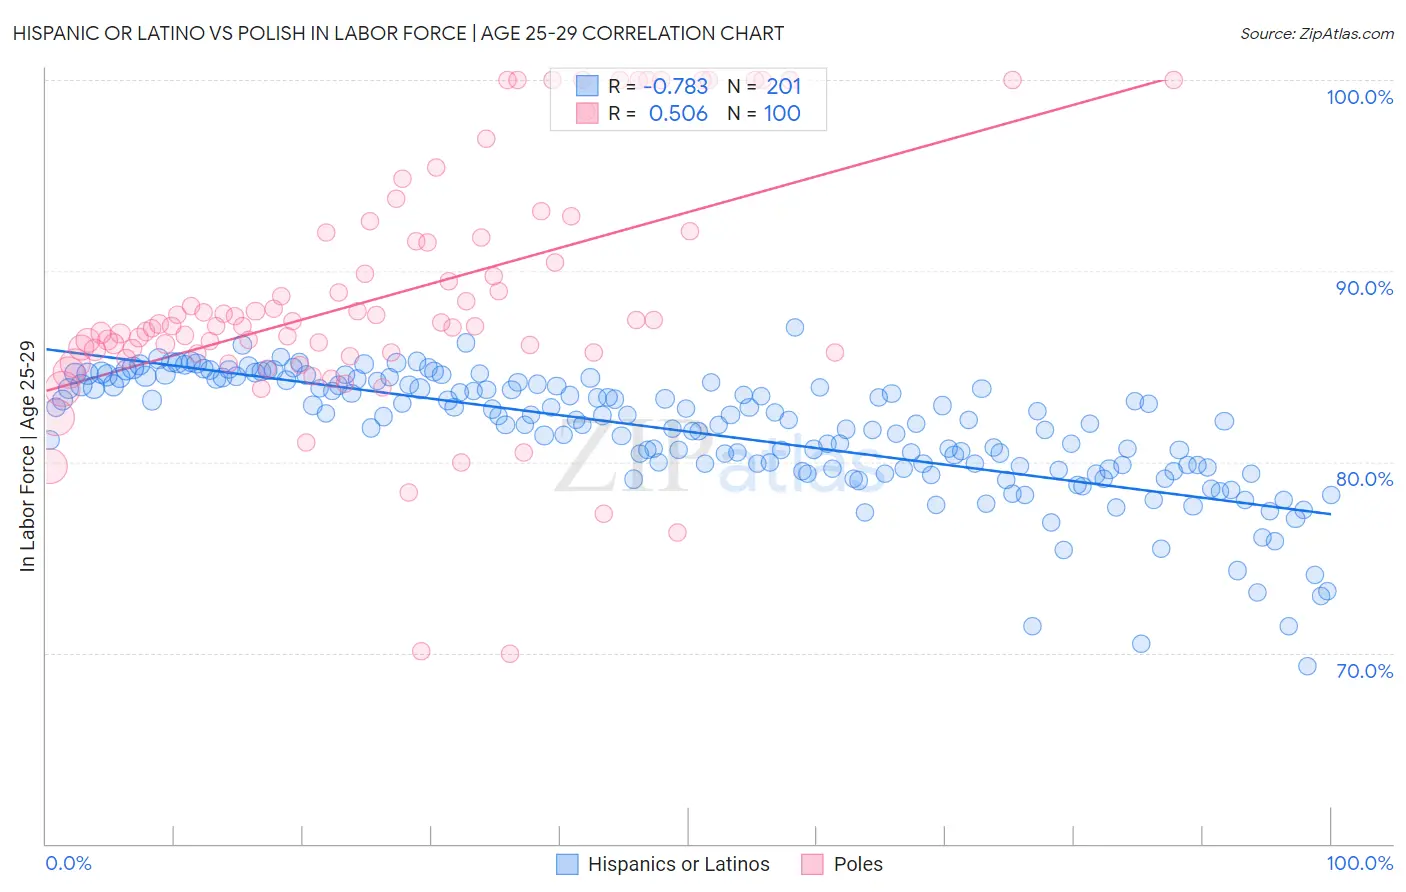
Hispanic or Latino vs Polish In Labor Force | Age 25-29 Correlation Chart
The statistical analysis conducted on geographies consisting of 577,042,190 people shows a strong negative correlation between the proportion of Hispanics or Latinos and labor force participation rate among population between the ages 25 and 29 in the United States with a correlation coefficient (R) of -0.783 and weighted average of 82.2%. Similarly, the statistical analysis conducted on geographies consisting of 559,462,142 people shows a substantial positive correlation between the proportion of Poles and labor force participation rate among population between the ages 25 and 29 in the United States with a correlation coefficient (R) of 0.506 and weighted average of 85.8%, a difference of 4.3%.
In Labor Force | Age 25-29 Correlation Summary
| Measurement | Hispanic or Latino | Polish |
| Minimum | 69.3% | 69.9% |
| Maximum | 87.0% | 100.0% |
| Range | 17.7% | 30.1% |
| Mean | 81.6% | 88.7% |
| Median | 82.2% | 87.2% |
| Interquartile 25% (IQ1) | 79.7% | 85.7% |
| Interquartile 75% (IQ3) | 84.1% | 91.9% |
| Interquartile Range (IQR) | 4.4% | 6.2% |
| Standard Deviation (Sample) | 3.2% | 6.4% |
| Standard Deviation (Population) | 3.2% | 6.4% |
Similar Demographics by In Labor Force | Age 25-29
Demographics Similar to Hispanics or Latinos by In Labor Force | Age 25-29
In terms of in labor force | age 25-29, the demographic groups most similar to Hispanics or Latinos are Alaskan Athabascan (82.3%, a difference of 0.070%), Osage (82.3%, a difference of 0.080%), Yaqui (82.2%, a difference of 0.10%), Cherokee (82.1%, a difference of 0.14%), and Immigrants from Central America (82.4%, a difference of 0.21%).
| Demographics | Rating | Rank | In Labor Force | Age 25-29 |
| Blacks/African Americans | 0.0 /100 | #305 | Tragic 82.6% |
| Blackfeet | 0.0 /100 | #306 | Tragic 82.6% |
| Cajuns | 0.0 /100 | #307 | Tragic 82.5% |
| Central American Indians | 0.0 /100 | #308 | Tragic 82.4% |
| Immigrants | Central America | 0.0 /100 | #309 | Tragic 82.4% |
| Osage | 0.0 /100 | #310 | Tragic 82.3% |
| Alaskan Athabascans | 0.0 /100 | #311 | Tragic 82.3% |
| Hispanics or Latinos | 0.0 /100 | #312 | Tragic 82.2% |
| Yaqui | 0.0 /100 | #313 | Tragic 82.2% |
| Cherokee | 0.0 /100 | #314 | Tragic 82.1% |
| Immigrants | Mexico | 0.0 /100 | #315 | Tragic 82.0% |
| Mexicans | 0.0 /100 | #316 | Tragic 81.9% |
| Chickasaw | 0.0 /100 | #317 | Tragic 81.9% |
| Comanche | 0.0 /100 | #318 | Tragic 81.9% |
| Seminole | 0.0 /100 | #319 | Tragic 81.7% |
Demographics Similar to Poles by In Labor Force | Age 25-29
In terms of in labor force | age 25-29, the demographic groups most similar to Poles are Sierra Leonean (85.8%, a difference of 0.020%), Cypriot (85.8%, a difference of 0.030%), Immigrants from Nepal (85.8%, a difference of 0.030%), Croatian (85.8%, a difference of 0.030%), and Lithuanian (85.8%, a difference of 0.040%).
| Demographics | Rating | Rank | In Labor Force | Age 25-29 |
| Immigrants | Serbia | 100.0 /100 | #30 | Exceptional 85.9% |
| German Russians | 100.0 /100 | #31 | Exceptional 85.8% |
| Slovaks | 100.0 /100 | #32 | Exceptional 85.8% |
| Immigrants | Bulgaria | 100.0 /100 | #33 | Exceptional 85.8% |
| Lithuanians | 99.9 /100 | #34 | Exceptional 85.8% |
| Cypriots | 99.9 /100 | #35 | Exceptional 85.8% |
| Immigrants | Nepal | 99.9 /100 | #36 | Exceptional 85.8% |
| Poles | 99.9 /100 | #37 | Exceptional 85.8% |
| Sierra Leoneans | 99.9 /100 | #38 | Exceptional 85.8% |
| Croatians | 99.9 /100 | #39 | Exceptional 85.8% |
| Immigrants | Albania | 99.9 /100 | #40 | Exceptional 85.7% |
| Immigrants | Greece | 99.9 /100 | #41 | Exceptional 85.7% |
| Immigrants | Eritrea | 99.9 /100 | #42 | Exceptional 85.7% |
| Immigrants | India | 99.9 /100 | #43 | Exceptional 85.7% |
| Macedonians | 99.9 /100 | #44 | Exceptional 85.7% |