Hispanic or Latino vs Panamanian Master's Degree
COMPARE
Hispanic or Latino
Panamanian
Master's Degree
Master's Degree Comparison
Hispanics or Latinos
Panamanians
10.9%
MASTER'S DEGREE
0.0/ 100
METRIC RATING
316th/ 347
METRIC RANK
14.4%
MASTER'S DEGREE
25.1/ 100
METRIC RATING
200th/ 347
METRIC RANK
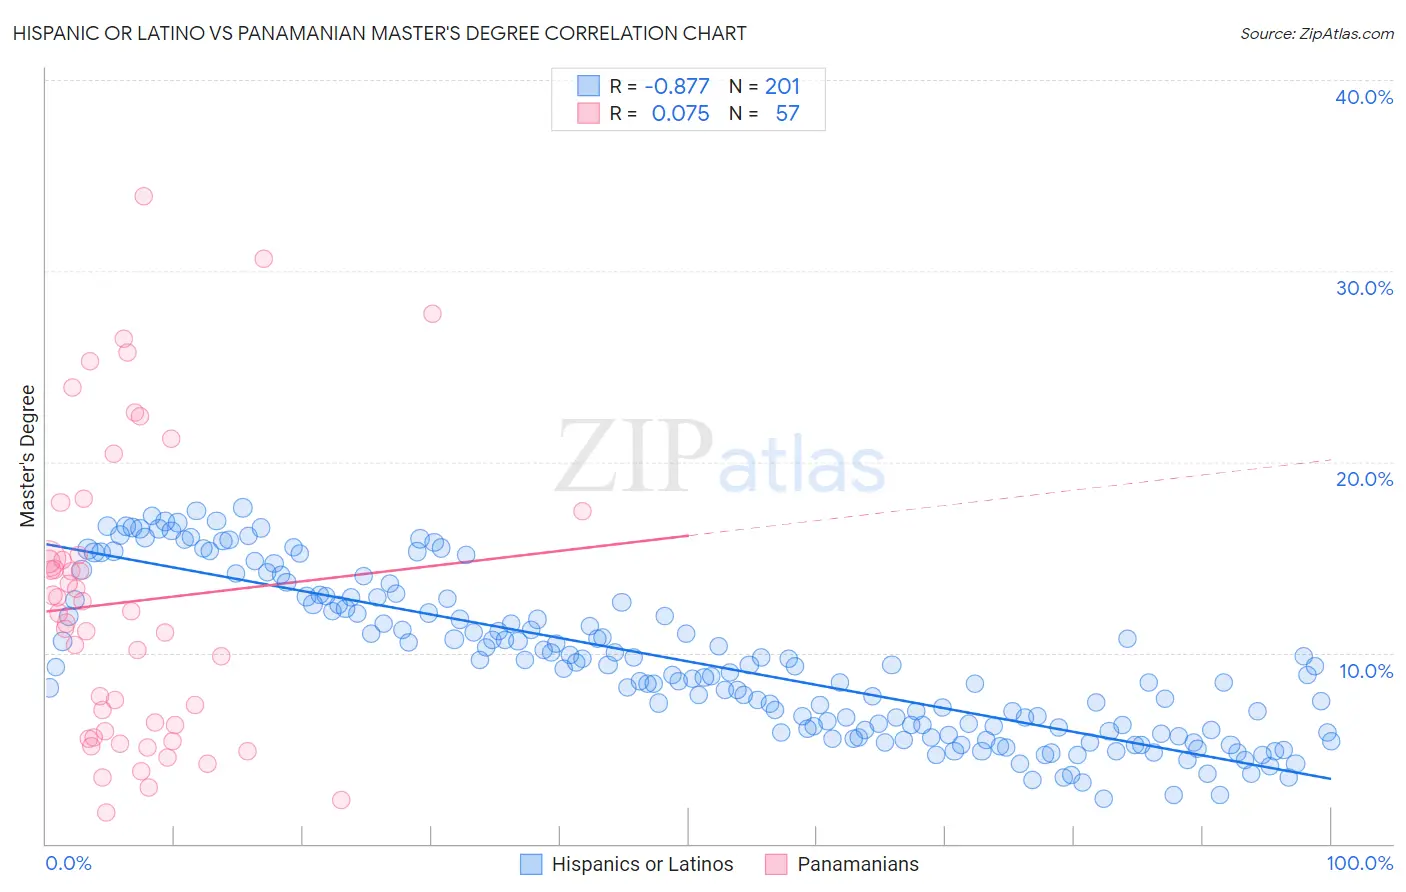
Hispanic or Latino vs Panamanian Master's Degree Correlation Chart
The statistical analysis conducted on geographies consisting of 577,228,232 people shows a very strong negative correlation between the proportion of Hispanics or Latinos and percentage of population with at least master's degree education in the United States with a correlation coefficient (R) of -0.877 and weighted average of 10.9%. Similarly, the statistical analysis conducted on geographies consisting of 281,151,832 people shows a slight positive correlation between the proportion of Panamanians and percentage of population with at least master's degree education in the United States with a correlation coefficient (R) of 0.075 and weighted average of 14.4%, a difference of 31.7%.
Master's Degree Correlation Summary
| Measurement | Hispanic or Latino | Panamanian |
| Minimum | 2.4% | 1.6% |
| Maximum | 17.6% | 33.9% |
| Range | 15.2% | 32.3% |
| Mean | 9.5% | 12.7% |
| Median | 9.2% | 12.1% |
| Interquartile 25% (IQ1) | 5.9% | 5.7% |
| Interquartile 75% (IQ3) | 12.7% | 16.3% |
| Interquartile Range (IQR) | 6.8% | 10.5% |
| Standard Deviation (Sample) | 4.1% | 7.8% |
| Standard Deviation (Population) | 4.1% | 7.7% |
Similar Demographics by Master's Degree
Demographics Similar to Hispanics or Latinos by Master's Degree
In terms of master's degree, the demographic groups most similar to Hispanics or Latinos are Apache (11.0%, a difference of 0.34%), Cajun (11.0%, a difference of 0.35%), Hopi (10.9%, a difference of 0.54%), Immigrants from Cuba (10.9%, a difference of 0.67%), and Yaqui (11.0%, a difference of 0.74%).
| Demographics | Rating | Rank | Master's Degree |
| Puget Sound Salish | 0.0 /100 | #309 | Tragic 11.1% |
| Shoshone | 0.0 /100 | #310 | Tragic 11.1% |
| Seminole | 0.0 /100 | #311 | Tragic 11.0% |
| Choctaw | 0.0 /100 | #312 | Tragic 11.0% |
| Yaqui | 0.0 /100 | #313 | Tragic 11.0% |
| Cajuns | 0.0 /100 | #314 | Tragic 11.0% |
| Apache | 0.0 /100 | #315 | Tragic 11.0% |
| Hispanics or Latinos | 0.0 /100 | #316 | Tragic 10.9% |
| Hopi | 0.0 /100 | #317 | Tragic 10.9% |
| Immigrants | Cuba | 0.0 /100 | #318 | Tragic 10.9% |
| Kiowa | 0.0 /100 | #319 | Tragic 10.8% |
| Immigrants | Micronesia | 0.0 /100 | #320 | Tragic 10.8% |
| Pennsylvania Germans | 0.0 /100 | #321 | Tragic 10.7% |
| Sioux | 0.0 /100 | #322 | Tragic 10.7% |
| Crow | 0.0 /100 | #323 | Tragic 10.6% |
Demographics Similar to Panamanians by Master's Degree
In terms of master's degree, the demographic groups most similar to Panamanians are Scotch-Irish (14.4%, a difference of 0.010%), Immigrants from Western Africa (14.4%, a difference of 0.020%), Yugoslavian (14.4%, a difference of 0.13%), French (14.4%, a difference of 0.25%), and Trinidadian and Tobagonian (14.4%, a difference of 0.28%).
| Demographics | Rating | Rank | Master's Degree |
| Immigrants | Nigeria | 32.7 /100 | #193 | Fair 14.6% |
| Chinese | 32.5 /100 | #194 | Fair 14.6% |
| Danes | 31.3 /100 | #195 | Fair 14.5% |
| Czechoslovakians | 29.9 /100 | #196 | Fair 14.5% |
| Belgians | 28.0 /100 | #197 | Fair 14.5% |
| West Indians | 27.4 /100 | #198 | Fair 14.5% |
| Immigrants | Armenia | 27.2 /100 | #199 | Fair 14.5% |
| Panamanians | 25.1 /100 | #200 | Fair 14.4% |
| Scotch-Irish | 25.0 /100 | #201 | Fair 14.4% |
| Immigrants | Western Africa | 24.9 /100 | #202 | Fair 14.4% |
| Yugoslavians | 24.3 /100 | #203 | Fair 14.4% |
| French | 23.7 /100 | #204 | Fair 14.4% |
| Trinidadians and Tobagonians | 23.5 /100 | #205 | Fair 14.4% |
| Scandinavians | 23.3 /100 | #206 | Fair 14.4% |
| Immigrants | Bosnia and Herzegovina | 22.0 /100 | #207 | Fair 14.3% |