Hispanic or Latino vs African In Labor Force | Age 25-29
COMPARE
Hispanic or Latino
African
In Labor Force | Age 25-29
In Labor Force | Age 25-29 Comparison
Hispanics or Latinos
Africans
82.2%
IN LABOR FORCE | AGE 25-29
0.0/ 100
METRIC RATING
312th/ 347
METRIC RANK
83.2%
IN LABOR FORCE | AGE 25-29
0.0/ 100
METRIC RATING
277th/ 347
METRIC RANK
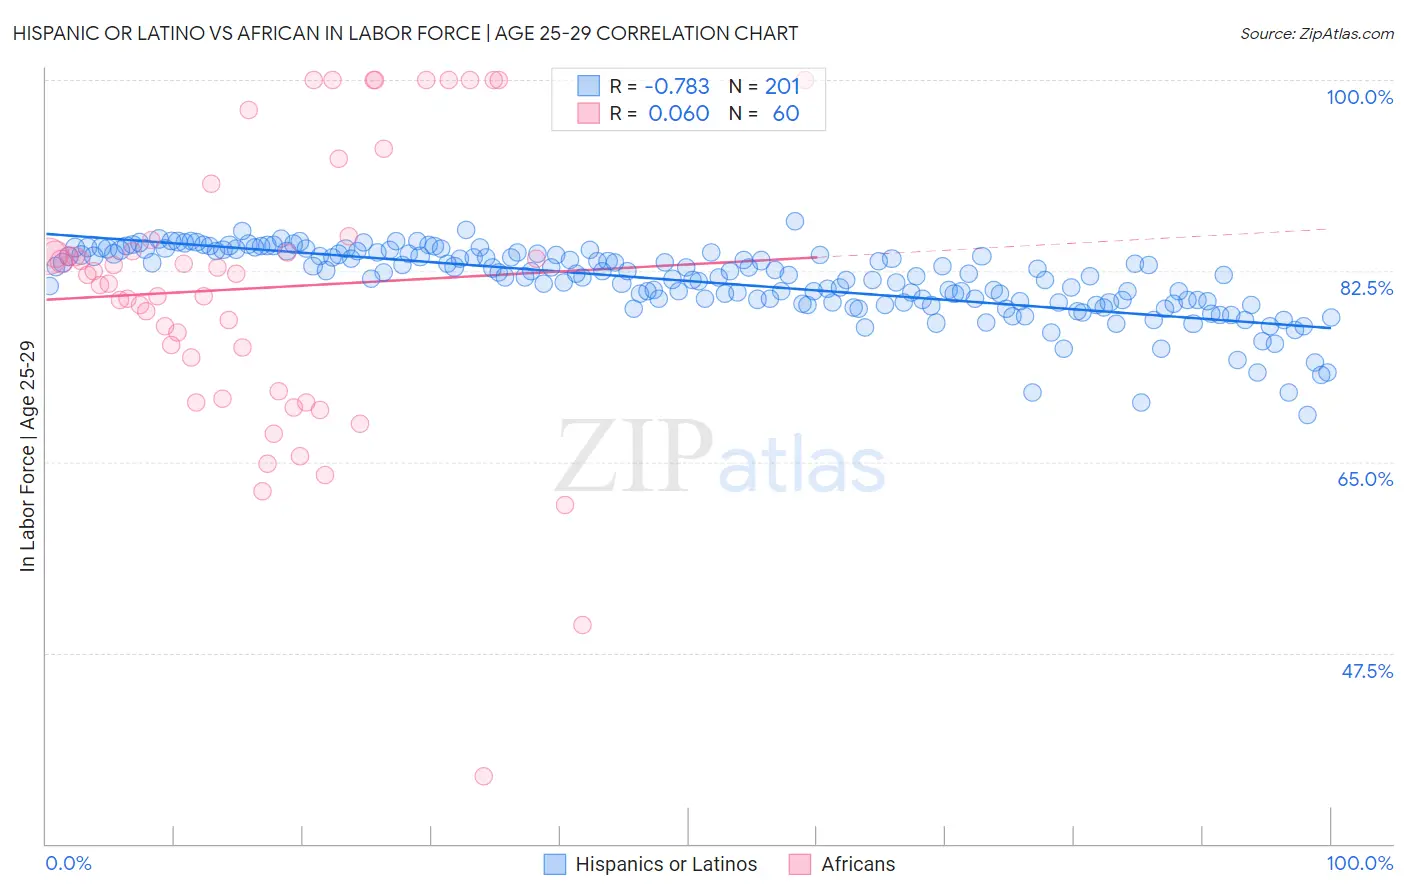
Hispanic or Latino vs African In Labor Force | Age 25-29 Correlation Chart
The statistical analysis conducted on geographies consisting of 577,042,190 people shows a strong negative correlation between the proportion of Hispanics or Latinos and labor force participation rate among population between the ages 25 and 29 in the United States with a correlation coefficient (R) of -0.783 and weighted average of 82.2%. Similarly, the statistical analysis conducted on geographies consisting of 469,793,386 people shows a slight positive correlation between the proportion of Africans and labor force participation rate among population between the ages 25 and 29 in the United States with a correlation coefficient (R) of 0.060 and weighted average of 83.2%, a difference of 1.2%.
In Labor Force | Age 25-29 Correlation Summary
| Measurement | Hispanic or Latino | African |
| Minimum | 69.3% | 36.2% |
| Maximum | 87.0% | 100.0% |
| Range | 17.7% | 63.8% |
| Mean | 81.6% | 81.0% |
| Median | 82.2% | 82.2% |
| Interquartile 25% (IQ1) | 79.7% | 73.0% |
| Interquartile 75% (IQ3) | 84.1% | 85.5% |
| Interquartile Range (IQR) | 4.4% | 12.5% |
| Standard Deviation (Sample) | 3.2% | 13.1% |
| Standard Deviation (Population) | 3.2% | 12.9% |
Similar Demographics by In Labor Force | Age 25-29
Demographics Similar to Hispanics or Latinos by In Labor Force | Age 25-29
In terms of in labor force | age 25-29, the demographic groups most similar to Hispanics or Latinos are Alaskan Athabascan (82.3%, a difference of 0.070%), Osage (82.3%, a difference of 0.080%), Yaqui (82.2%, a difference of 0.10%), Cherokee (82.1%, a difference of 0.14%), and Immigrants from Central America (82.4%, a difference of 0.21%).
| Demographics | Rating | Rank | In Labor Force | Age 25-29 |
| Blacks/African Americans | 0.0 /100 | #305 | Tragic 82.6% |
| Blackfeet | 0.0 /100 | #306 | Tragic 82.6% |
| Cajuns | 0.0 /100 | #307 | Tragic 82.5% |
| Central American Indians | 0.0 /100 | #308 | Tragic 82.4% |
| Immigrants | Central America | 0.0 /100 | #309 | Tragic 82.4% |
| Osage | 0.0 /100 | #310 | Tragic 82.3% |
| Alaskan Athabascans | 0.0 /100 | #311 | Tragic 82.3% |
| Hispanics or Latinos | 0.0 /100 | #312 | Tragic 82.2% |
| Yaqui | 0.0 /100 | #313 | Tragic 82.2% |
| Cherokee | 0.0 /100 | #314 | Tragic 82.1% |
| Immigrants | Mexico | 0.0 /100 | #315 | Tragic 82.0% |
| Mexicans | 0.0 /100 | #316 | Tragic 81.9% |
| Chickasaw | 0.0 /100 | #317 | Tragic 81.9% |
| Comanche | 0.0 /100 | #318 | Tragic 81.9% |
| Seminole | 0.0 /100 | #319 | Tragic 81.7% |
Demographics Similar to Africans by In Labor Force | Age 25-29
In terms of in labor force | age 25-29, the demographic groups most similar to Africans are Immigrants from Cuba (83.2%, a difference of 0.050%), British West Indian (83.2%, a difference of 0.060%), Samoan (83.3%, a difference of 0.070%), Immigrants from Honduras (83.3%, a difference of 0.070%), and Dominican (83.2%, a difference of 0.080%).
| Demographics | Rating | Rank | In Labor Force | Age 25-29 |
| Basques | 0.0 /100 | #270 | Tragic 83.4% |
| Hondurans | 0.0 /100 | #271 | Tragic 83.4% |
| Immigrants | Caribbean | 0.0 /100 | #272 | Tragic 83.4% |
| Immigrants | Dominica | 0.0 /100 | #273 | Tragic 83.4% |
| Marshallese | 0.0 /100 | #274 | Tragic 83.3% |
| Samoans | 0.0 /100 | #275 | Tragic 83.3% |
| Immigrants | Honduras | 0.0 /100 | #276 | Tragic 83.3% |
| Africans | 0.0 /100 | #277 | Tragic 83.2% |
| Immigrants | Cuba | 0.0 /100 | #278 | Tragic 83.2% |
| British West Indians | 0.0 /100 | #279 | Tragic 83.2% |
| Dominicans | 0.0 /100 | #280 | Tragic 83.2% |
| Immigrants | Dominican Republic | 0.0 /100 | #281 | Tragic 83.1% |
| Americans | 0.0 /100 | #282 | Tragic 83.1% |
| Immigrants | Azores | 0.0 /100 | #283 | Tragic 83.1% |
| Nicaraguans | 0.0 /100 | #284 | Tragic 83.1% |