Hispanic or Latino vs Immigrants from Hungary In Labor Force | Age 25-29
COMPARE
Hispanic or Latino
Immigrants from Hungary
In Labor Force | Age 25-29
In Labor Force | Age 25-29 Comparison
Hispanics or Latinos
Immigrants from Hungary
82.2%
IN LABOR FORCE | AGE 25-29
0.0/ 100
METRIC RATING
312th/ 347
METRIC RANK
84.8%
IN LABOR FORCE | AGE 25-29
76.4/ 100
METRIC RATING
135th/ 347
METRIC RANK
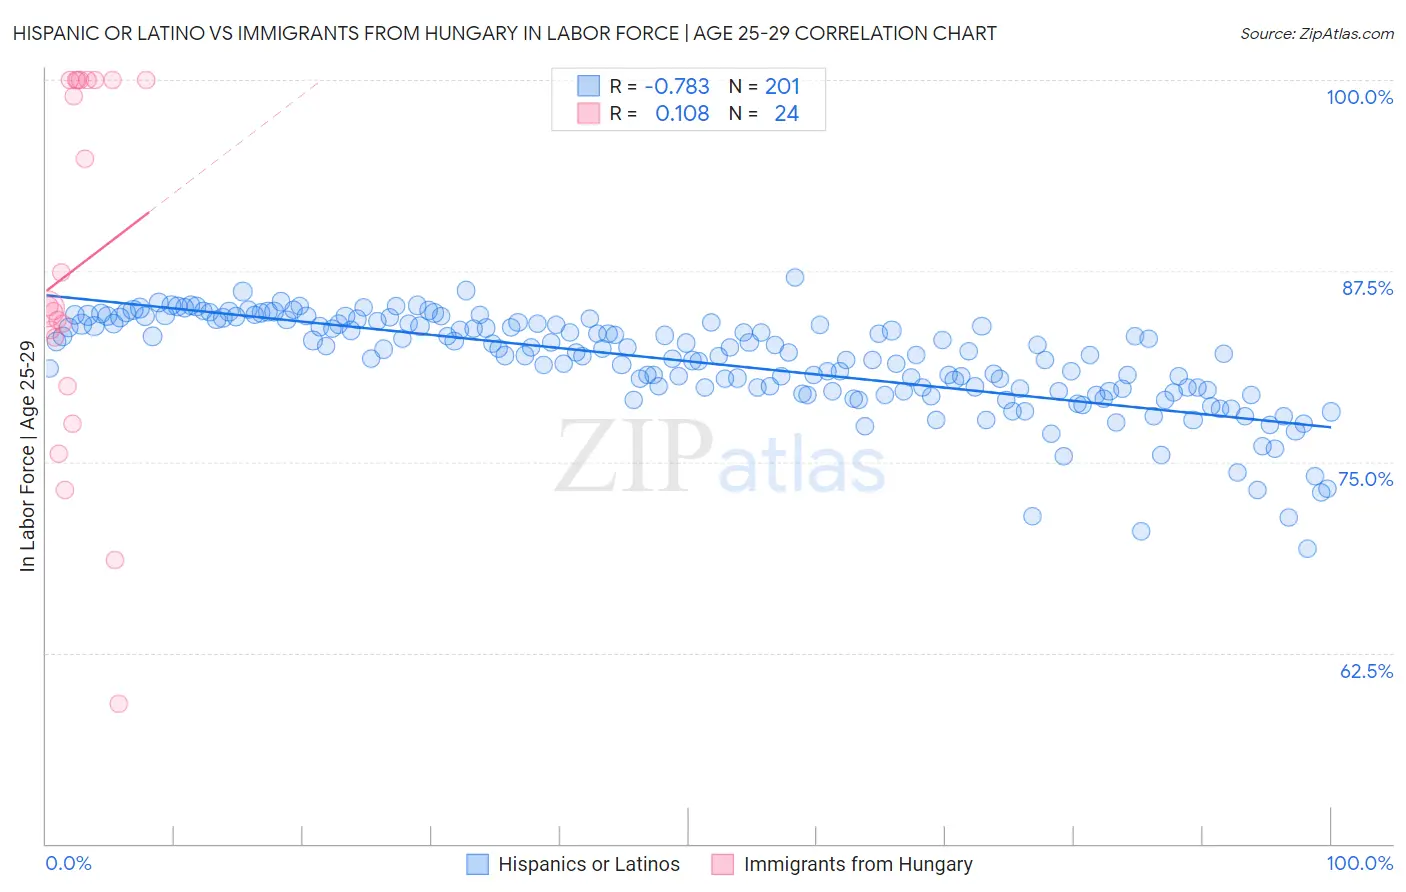
Hispanic or Latino vs Immigrants from Hungary In Labor Force | Age 25-29 Correlation Chart
The statistical analysis conducted on geographies consisting of 577,042,190 people shows a strong negative correlation between the proportion of Hispanics or Latinos and labor force participation rate among population between the ages 25 and 29 in the United States with a correlation coefficient (R) of -0.783 and weighted average of 82.2%. Similarly, the statistical analysis conducted on geographies consisting of 195,638,068 people shows a poor positive correlation between the proportion of Immigrants from Hungary and labor force participation rate among population between the ages 25 and 29 in the United States with a correlation coefficient (R) of 0.108 and weighted average of 84.8%, a difference of 3.2%.
In Labor Force | Age 25-29 Correlation Summary
| Measurement | Hispanic or Latino | Immigrants from Hungary |
| Minimum | 69.3% | 59.2% |
| Maximum | 87.0% | 100.0% |
| Range | 17.7% | 40.8% |
| Mean | 81.6% | 87.7% |
| Median | 82.2% | 85.1% |
| Interquartile 25% (IQ1) | 79.7% | 81.6% |
| Interquartile 75% (IQ3) | 84.1% | 100.0% |
| Interquartile Range (IQR) | 4.4% | 18.4% |
| Standard Deviation (Sample) | 3.2% | 11.7% |
| Standard Deviation (Population) | 3.2% | 11.5% |
Similar Demographics by In Labor Force | Age 25-29
Demographics Similar to Hispanics or Latinos by In Labor Force | Age 25-29
In terms of in labor force | age 25-29, the demographic groups most similar to Hispanics or Latinos are Alaskan Athabascan (82.3%, a difference of 0.070%), Osage (82.3%, a difference of 0.080%), Yaqui (82.2%, a difference of 0.10%), Cherokee (82.1%, a difference of 0.14%), and Immigrants from Central America (82.4%, a difference of 0.21%).
| Demographics | Rating | Rank | In Labor Force | Age 25-29 |
| Blacks/African Americans | 0.0 /100 | #305 | Tragic 82.6% |
| Blackfeet | 0.0 /100 | #306 | Tragic 82.6% |
| Cajuns | 0.0 /100 | #307 | Tragic 82.5% |
| Central American Indians | 0.0 /100 | #308 | Tragic 82.4% |
| Immigrants | Central America | 0.0 /100 | #309 | Tragic 82.4% |
| Osage | 0.0 /100 | #310 | Tragic 82.3% |
| Alaskan Athabascans | 0.0 /100 | #311 | Tragic 82.3% |
| Hispanics or Latinos | 0.0 /100 | #312 | Tragic 82.2% |
| Yaqui | 0.0 /100 | #313 | Tragic 82.2% |
| Cherokee | 0.0 /100 | #314 | Tragic 82.1% |
| Immigrants | Mexico | 0.0 /100 | #315 | Tragic 82.0% |
| Mexicans | 0.0 /100 | #316 | Tragic 81.9% |
| Chickasaw | 0.0 /100 | #317 | Tragic 81.9% |
| Comanche | 0.0 /100 | #318 | Tragic 81.9% |
| Seminole | 0.0 /100 | #319 | Tragic 81.7% |
Demographics Similar to Immigrants from Hungary by In Labor Force | Age 25-29
In terms of in labor force | age 25-29, the demographic groups most similar to Immigrants from Hungary are Syrian (84.8%, a difference of 0.0%), Bhutanese (84.8%, a difference of 0.0%), Romanian (84.8%, a difference of 0.010%), Asian (84.8%, a difference of 0.010%), and Iranian (84.8%, a difference of 0.020%).
| Demographics | Rating | Rank | In Labor Force | Age 25-29 |
| Australians | 83.6 /100 | #128 | Excellent 84.9% |
| Immigrants | Russia | 81.6 /100 | #129 | Excellent 84.9% |
| Northern Europeans | 81.3 /100 | #130 | Excellent 84.9% |
| Iranians | 78.1 /100 | #131 | Good 84.8% |
| Romanians | 77.7 /100 | #132 | Good 84.8% |
| Asians | 77.7 /100 | #133 | Good 84.8% |
| Syrians | 76.5 /100 | #134 | Good 84.8% |
| Immigrants | Hungary | 76.4 /100 | #135 | Good 84.8% |
| Bhutanese | 76.0 /100 | #136 | Good 84.8% |
| Immigrants | Canada | 73.5 /100 | #137 | Good 84.8% |
| Armenians | 72.7 /100 | #138 | Good 84.8% |
| Immigrants | Eastern Asia | 72.6 /100 | #139 | Good 84.8% |
| Immigrants | North America | 72.1 /100 | #140 | Good 84.8% |
| Danes | 71.9 /100 | #141 | Good 84.8% |
| Pakistanis | 70.0 /100 | #142 | Good 84.8% |