Hispanic or Latino vs Immigrants from Chile In Labor Force | Age 20-64
COMPARE
Hispanic or Latino
Immigrants from Chile
In Labor Force | Age 20-64
In Labor Force | Age 20-64 Comparison
Hispanics or Latinos
Immigrants from Chile
77.6%
IN LABOR FORCE | AGE 20-64
0.0/ 100
METRIC RATING
299th/ 347
METRIC RANK
80.1%
IN LABOR FORCE | AGE 20-64
95.7/ 100
METRIC RATING
99th/ 347
METRIC RANK
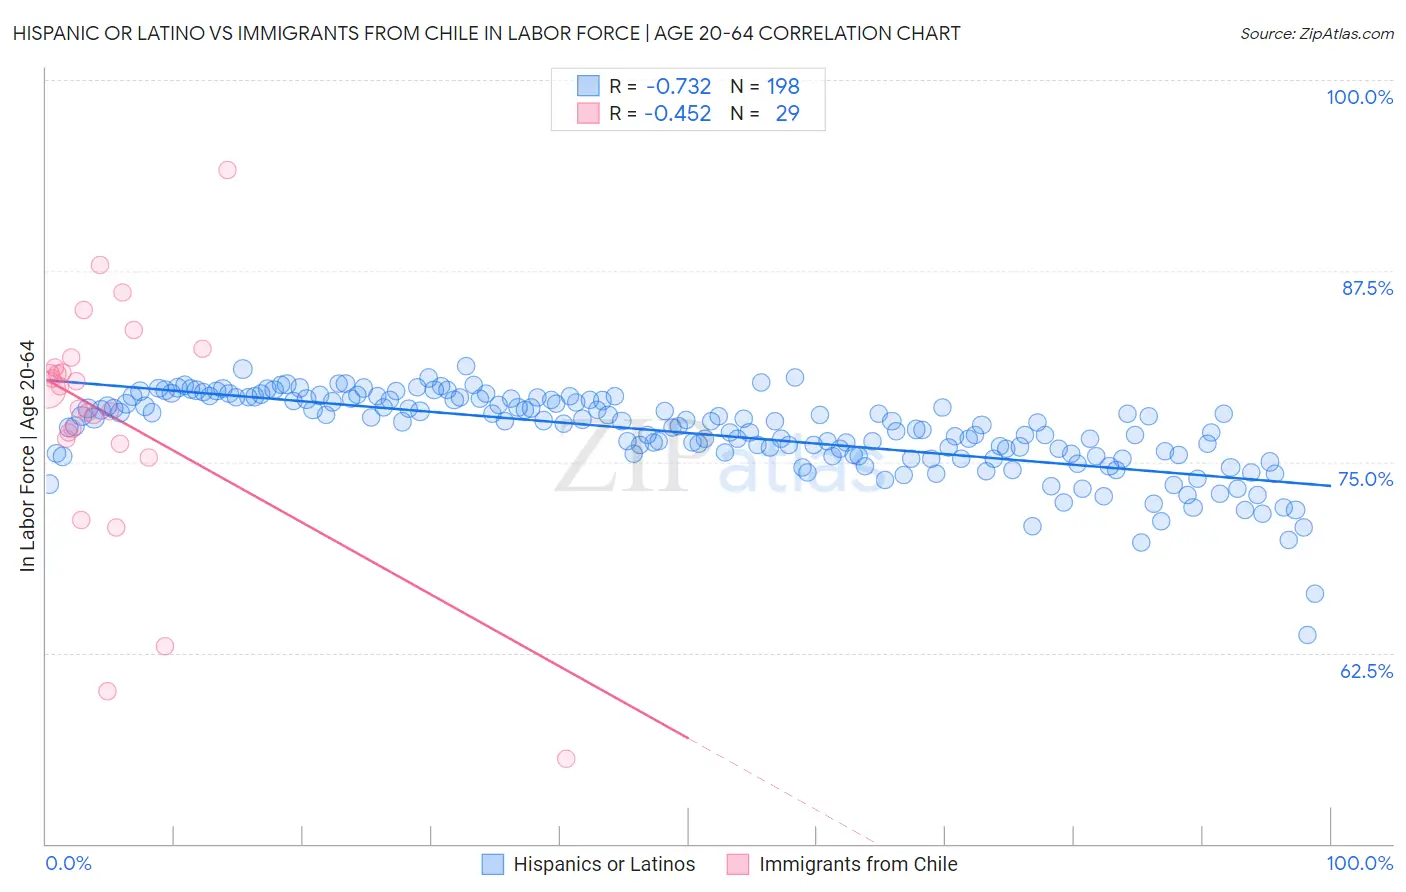
Hispanic or Latino vs Immigrants from Chile In Labor Force | Age 20-64 Correlation Chart
The statistical analysis conducted on geographies consisting of 575,448,606 people shows a strong negative correlation between the proportion of Hispanics or Latinos and labor force participation rate among population between the ages 20 and 64 in the United States with a correlation coefficient (R) of -0.732 and weighted average of 77.6%. Similarly, the statistical analysis conducted on geographies consisting of 218,647,266 people shows a moderate negative correlation between the proportion of Immigrants from Chile and labor force participation rate among population between the ages 20 and 64 in the United States with a correlation coefficient (R) of -0.452 and weighted average of 80.1%, a difference of 3.2%.
In Labor Force | Age 20-64 Correlation Summary
| Measurement | Hispanic or Latino | Immigrants from Chile |
| Minimum | 63.7% | 55.6% |
| Maximum | 81.2% | 94.1% |
| Range | 17.6% | 38.5% |
| Mean | 76.9% | 77.9% |
| Median | 77.6% | 79.7% |
| Interquartile 25% (IQ1) | 75.4% | 76.4% |
| Interquartile 75% (IQ3) | 79.1% | 81.5% |
| Interquartile Range (IQR) | 3.7% | 5.2% |
| Standard Deviation (Sample) | 2.7% | 7.9% |
| Standard Deviation (Population) | 2.7% | 7.8% |
Similar Demographics by In Labor Force | Age 20-64
Demographics Similar to Hispanics or Latinos by In Labor Force | Age 20-64
In terms of in labor force | age 20-64, the demographic groups most similar to Hispanics or Latinos are Cree (77.7%, a difference of 0.060%), Immigrants from Dominican Republic (77.7%, a difference of 0.070%), Dominican (77.7%, a difference of 0.070%), Spanish American Indian (77.6%, a difference of 0.070%), and Immigrants from Grenada (77.7%, a difference of 0.11%).
| Demographics | Rating | Rank | In Labor Force | Age 20-64 |
| Immigrants | Azores | 0.0 /100 | #292 | Tragic 77.8% |
| Delaware | 0.0 /100 | #293 | Tragic 77.8% |
| Immigrants | Central America | 0.0 /100 | #294 | Tragic 77.7% |
| Immigrants | Grenada | 0.0 /100 | #295 | Tragic 77.7% |
| Immigrants | Dominican Republic | 0.0 /100 | #296 | Tragic 77.7% |
| Dominicans | 0.0 /100 | #297 | Tragic 77.7% |
| Cree | 0.0 /100 | #298 | Tragic 77.7% |
| Hispanics or Latinos | 0.0 /100 | #299 | Tragic 77.6% |
| Spanish American Indians | 0.0 /100 | #300 | Tragic 77.6% |
| Nepalese | 0.0 /100 | #301 | Tragic 77.5% |
| Iroquois | 0.0 /100 | #302 | Tragic 77.5% |
| Chippewa | 0.0 /100 | #303 | Tragic 77.3% |
| Immigrants | Mexico | 0.0 /100 | #304 | Tragic 77.3% |
| Mexicans | 0.0 /100 | #305 | Tragic 77.2% |
| Potawatomi | 0.0 /100 | #306 | Tragic 77.2% |
Demographics Similar to Immigrants from Chile by In Labor Force | Age 20-64
In terms of in labor force | age 20-64, the demographic groups most similar to Immigrants from Chile are Yugoslavian (80.1%, a difference of 0.010%), Immigrants from Malaysia (80.1%, a difference of 0.010%), South American (80.1%, a difference of 0.010%), Immigrants from Uruguay (80.1%, a difference of 0.010%), and Filipino (80.1%, a difference of 0.010%).
| Demographics | Rating | Rank | In Labor Force | Age 20-64 |
| Ghanaians | 96.7 /100 | #92 | Exceptional 80.1% |
| Immigrants | Belarus | 96.4 /100 | #93 | Exceptional 80.1% |
| Immigrants | Asia | 96.0 /100 | #94 | Exceptional 80.1% |
| Yugoslavians | 95.9 /100 | #95 | Exceptional 80.1% |
| Immigrants | Malaysia | 95.9 /100 | #96 | Exceptional 80.1% |
| South Americans | 95.9 /100 | #97 | Exceptional 80.1% |
| Immigrants | Uruguay | 95.8 /100 | #98 | Exceptional 80.1% |
| Immigrants | Chile | 95.7 /100 | #99 | Exceptional 80.1% |
| Filipinos | 95.6 /100 | #100 | Exceptional 80.1% |
| Palestinians | 95.5 /100 | #101 | Exceptional 80.0% |
| Immigrants | Australia | 95.5 /100 | #102 | Exceptional 80.0% |
| Russians | 95.5 /100 | #103 | Exceptional 80.0% |
| Venezuelans | 95.3 /100 | #104 | Exceptional 80.0% |
| Immigrants | Ghana | 95.0 /100 | #105 | Exceptional 80.0% |
| Greeks | 94.8 /100 | #106 | Exceptional 80.0% |