Hispanic or Latino vs Ecuadorian In Labor Force | Age 20-64
COMPARE
Hispanic or Latino
Ecuadorian
In Labor Force | Age 20-64
In Labor Force | Age 20-64 Comparison
Hispanics or Latinos
Ecuadorians
77.6%
IN LABOR FORCE | AGE 20-64
0.0/ 100
METRIC RATING
299th/ 347
METRIC RANK
79.4%
IN LABOR FORCE | AGE 20-64
23.1/ 100
METRIC RATING
196th/ 347
METRIC RANK
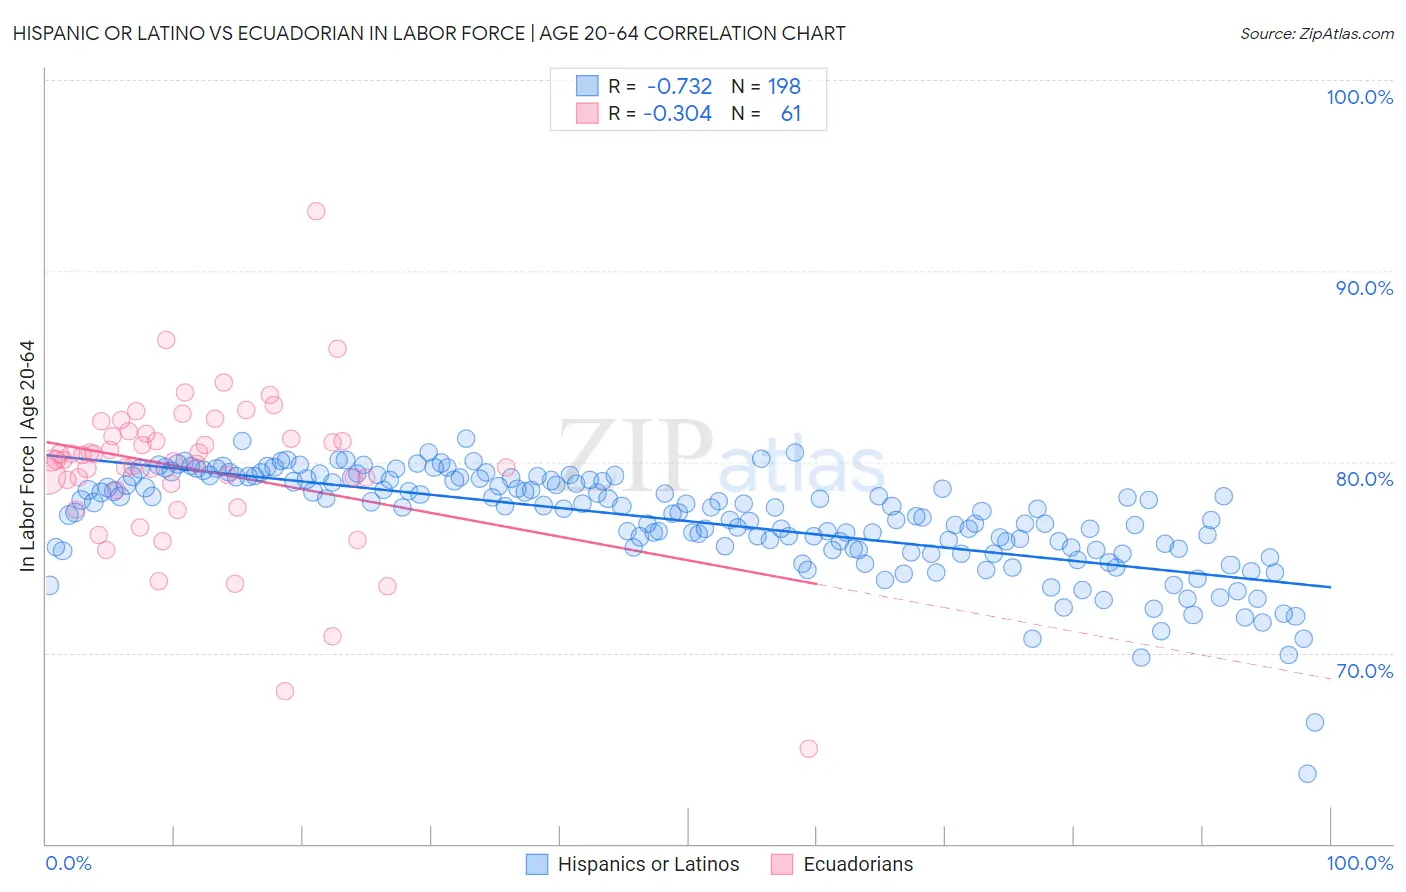
Hispanic or Latino vs Ecuadorian In Labor Force | Age 20-64 Correlation Chart
The statistical analysis conducted on geographies consisting of 575,448,606 people shows a strong negative correlation between the proportion of Hispanics or Latinos and labor force participation rate among population between the ages 20 and 64 in the United States with a correlation coefficient (R) of -0.732 and weighted average of 77.6%. Similarly, the statistical analysis conducted on geographies consisting of 317,839,465 people shows a mild negative correlation between the proportion of Ecuadorians and labor force participation rate among population between the ages 20 and 64 in the United States with a correlation coefficient (R) of -0.304 and weighted average of 79.4%, a difference of 2.3%.
In Labor Force | Age 20-64 Correlation Summary
| Measurement | Hispanic or Latino | Ecuadorian |
| Minimum | 63.7% | 65.0% |
| Maximum | 81.2% | 93.1% |
| Range | 17.6% | 28.1% |
| Mean | 76.9% | 79.6% |
| Median | 77.6% | 80.1% |
| Interquartile 25% (IQ1) | 75.4% | 78.7% |
| Interquartile 75% (IQ3) | 79.1% | 81.4% |
| Interquartile Range (IQR) | 3.7% | 2.7% |
| Standard Deviation (Sample) | 2.7% | 4.1% |
| Standard Deviation (Population) | 2.7% | 4.1% |
Similar Demographics by In Labor Force | Age 20-64
Demographics Similar to Hispanics or Latinos by In Labor Force | Age 20-64
In terms of in labor force | age 20-64, the demographic groups most similar to Hispanics or Latinos are Cree (77.7%, a difference of 0.060%), Immigrants from Dominican Republic (77.7%, a difference of 0.070%), Dominican (77.7%, a difference of 0.070%), Spanish American Indian (77.6%, a difference of 0.070%), and Immigrants from Grenada (77.7%, a difference of 0.11%).
| Demographics | Rating | Rank | In Labor Force | Age 20-64 |
| Immigrants | Azores | 0.0 /100 | #292 | Tragic 77.8% |
| Delaware | 0.0 /100 | #293 | Tragic 77.8% |
| Immigrants | Central America | 0.0 /100 | #294 | Tragic 77.7% |
| Immigrants | Grenada | 0.0 /100 | #295 | Tragic 77.7% |
| Immigrants | Dominican Republic | 0.0 /100 | #296 | Tragic 77.7% |
| Dominicans | 0.0 /100 | #297 | Tragic 77.7% |
| Cree | 0.0 /100 | #298 | Tragic 77.7% |
| Hispanics or Latinos | 0.0 /100 | #299 | Tragic 77.6% |
| Spanish American Indians | 0.0 /100 | #300 | Tragic 77.6% |
| Nepalese | 0.0 /100 | #301 | Tragic 77.5% |
| Iroquois | 0.0 /100 | #302 | Tragic 77.5% |
| Chippewa | 0.0 /100 | #303 | Tragic 77.3% |
| Immigrants | Mexico | 0.0 /100 | #304 | Tragic 77.3% |
| Mexicans | 0.0 /100 | #305 | Tragic 77.2% |
| Potawatomi | 0.0 /100 | #306 | Tragic 77.2% |
Demographics Similar to Ecuadorians by In Labor Force | Age 20-64
In terms of in labor force | age 20-64, the demographic groups most similar to Ecuadorians are Immigrants from Austria (79.4%, a difference of 0.010%), Immigrants from Senegal (79.4%, a difference of 0.010%), Immigrants from Thailand (79.4%, a difference of 0.020%), Immigrants from Laos (79.4%, a difference of 0.020%), and Indonesian (79.4%, a difference of 0.030%).
| Demographics | Rating | Rank | In Labor Force | Age 20-64 |
| Immigrants | El Salvador | 30.9 /100 | #189 | Fair 79.4% |
| Immigrants | Syria | 30.8 /100 | #190 | Fair 79.4% |
| Swiss | 28.9 /100 | #191 | Fair 79.4% |
| Immigrants | Denmark | 26.9 /100 | #192 | Fair 79.4% |
| Indonesians | 26.1 /100 | #193 | Fair 79.4% |
| Immigrants | Thailand | 24.8 /100 | #194 | Fair 79.4% |
| Immigrants | Austria | 23.7 /100 | #195 | Fair 79.4% |
| Ecuadorians | 23.1 /100 | #196 | Fair 79.4% |
| Immigrants | Senegal | 22.5 /100 | #197 | Fair 79.4% |
| Immigrants | Laos | 21.5 /100 | #198 | Fair 79.4% |
| Dutch | 20.2 /100 | #199 | Fair 79.3% |
| Immigrants | Oceania | 19.1 /100 | #200 | Poor 79.3% |
| Immigrants | Nicaragua | 19.0 /100 | #201 | Poor 79.3% |
| Nicaraguans | 18.3 /100 | #202 | Poor 79.3% |
| Iraqis | 17.7 /100 | #203 | Poor 79.3% |